A total of all graded work (midterms, graded homework and quizzes, and final exam) will be used to produce a ranking of the class, so that I will know who has the (for example) twentyninth best score in the class. To arrive at the letter grades for the course, letter grades will be assigned on the common final exam and the number of scores with each grade on the exam in each lecture section will equal (up to a small adjustment) the number of that letter grade that will be assigned in that lecture section. Any projection of grades on midterm exams is based on a guess about both the quality of the work relative to the historical standards of the course and the distribution of grades in the course.
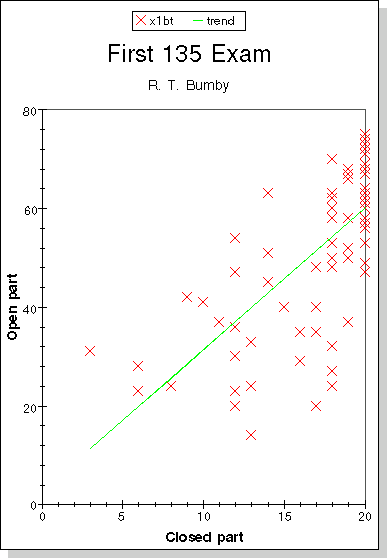
For the first exam, there were two parts: part A dealt with the use of differentiation formulas from memory, with no formula sheet or calculator available; part B gave a survey of all topics met so far in the course, allowing both formula sheet and calculator to aid in solving the problems. A scatter plot, with a trend line, is included to show the relation between these two parts of the score. There are also two tables giving information about grades on the exam. In the table of problem averages, scaling means that the raw score has been multiplied by 10 over the maximum score allowed for the problem to allow easy comparison between problems by treating them as if each problem was scored on a basis of 10 points. The other table shows clusters of grades with an estimated equivalence to letter grades. The scores shown were actually attained, so there are usually gaps between the clusters. In some case, grades are combined to avoid giving the impression that a single point on the exam makes a difference between different letter grades. These grades are only projections, but a grade lower than expected indicates a need for more effective preparation for the exams.
| Exam 1 |
|
|
|---|---|---|
The averages on the two parts of the exam were 17.01 out of 20 on Part A and 51.53 out of 80 on Part B for a combined average of 68.54.
| Exam 2 |
|
|
|---|---|---|
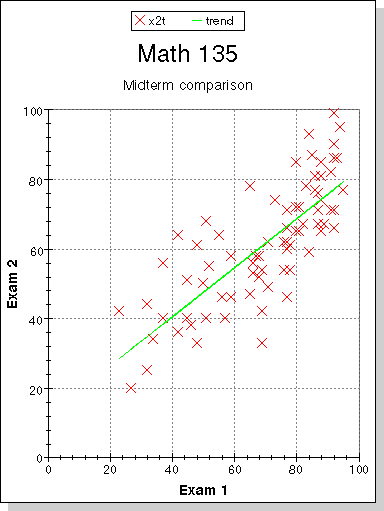
The scatter plot compares the scores on the two midterm exams.
The averages on the two parts of the exam were 15.31 out of 25 on part A and 46.2 out of 75 on part B for a combined average of 61.51.
When exams were returned on November 21, there were some comments that one point was lost on problem A5 if results were not expressed as a single decimal number. However, no such requirement was announced and the presentation of similar problems at the review session did not include such a step. Since this is a widespread problem with grading, it will be assumed that all grades of 4 on this problem had this cause and they will be raised to 5 in the course records with an individual review. However, the original grades will continue to be used in the tables and graphs on this page.
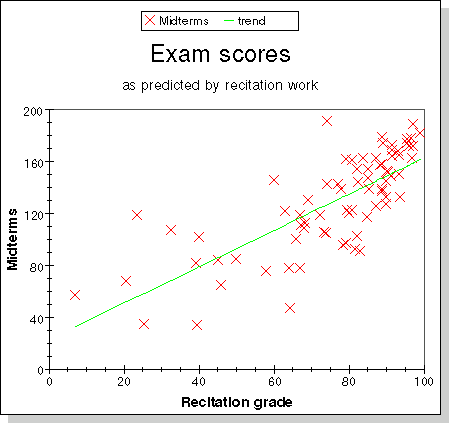
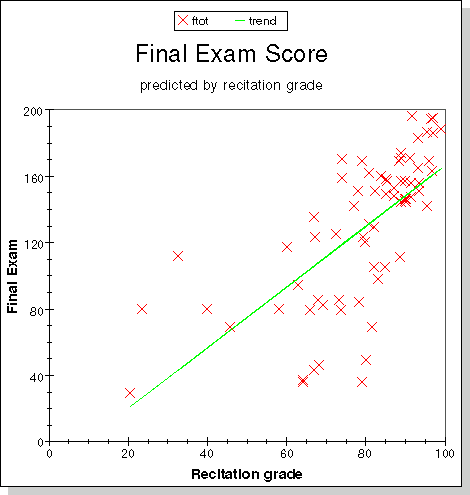
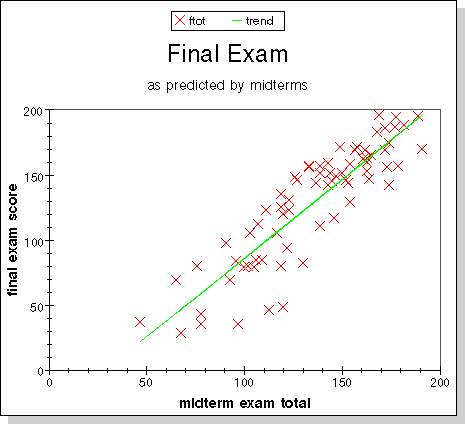
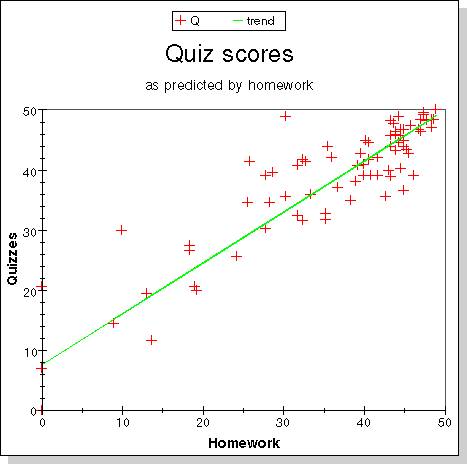 Some more scatter plots were prepared to show the relation between
different components of the grade: (1) Homework versus quizzes; (2)
recitation work versus midterm exams; (3) recitation work versus final
exam; (4)midterm exams versus final exam. All show that all components
of the grade are well correlated, that is, doing well in one suggests
that you will do well in all. We like to believe that this means that
all parts of the grade measure the effort you put into mastering the
subject, and that regular work is the best preparation for exams.
Although the weighting of these parts seems to make little difference
in determining class rank, one formula needed to be chosen. Class
rank was determined using 50 points for homework, 50 points for
quizzes, 100 points for each midterm and 200 points for the final.
Course coordination policy required that course grades be distributed
in the same way as final exam grades, with slight adjustments allowed
to avoid splitting clusters of grades. This led to this section
having a concentration of grades of B although the whole course had a
more even distribution of grades (except that the grade of D is used
rarely in mathematics courses).
Some more scatter plots were prepared to show the relation between
different components of the grade: (1) Homework versus quizzes; (2)
recitation work versus midterm exams; (3) recitation work versus final
exam; (4)midterm exams versus final exam. All show that all components
of the grade are well correlated, that is, doing well in one suggests
that you will do well in all. We like to believe that this means that
all parts of the grade measure the effort you put into mastering the
subject, and that regular work is the best preparation for exams.
Although the weighting of these parts seems to make little difference
in determining class rank, one formula needed to be chosen. Class
rank was determined using 50 points for homework, 50 points for
quizzes, 100 points for each midterm and 200 points for the final.
Course coordination policy required that course grades be distributed
in the same way as final exam grades, with slight adjustments allowed
to avoid splitting clusters of grades. This led to this section
having a concentration of grades of B although the whole course had a
more even distribution of grades (except that the grade of D is used
rarely in mathematics courses).
 In addition to grade distribution, a table of scaled averages for each
problem is available. Version A had the white cover; version B had
the green cover; version C had the blue cover; and versin D had the
yellow cover.
In addition to grade distribution, a table of scaled averages for each
problem is available. Version A had the white cover; version B had
the green cover; version C had the blue cover; and versin D had the
yellow cover.
| Final Exam |
|
|
|---|---|---|
They are in two formats: the viewing format has two slides per page, and the printing format has four slides per page. Some typographical errors may remain in these files. Since the material is typeset, it would be necessary to recreate them from the source to make these corrections, but the tools for doing this or on my home computer, so there may be some delay in making corrections. The survey of handwritten slides was produced only for viewing.