Statistical Analysis of Talmudic Family Planning
By Lucy Martinez and Doron Zeilberger
.tex [YET TO BE WRITTEN]
.pdf
Written: Nov. 2025
Maple package
-
TFP.txt,
a Maple package to the statistics of the duration of Talmudic multi-gender family planning, or equivalently
the number of dice-rolls until you achieve some specified quotas for the number of occurrences of the various faces
Sample Input and Output for TFP.txt
-
If you want to see recurrences for the quantity L(p,h,t), for the expected number of coin tosses until you reach h Heads and t Tails where the Pr(H)=p
and applying it to some special cases.
the input file
yields the output file
-
If you want to see the linear recurrence (the same!) for the prob. generating function according to the number of tosses until you
reach for the first time
- n Heads OR n Tails
- n Heads AND n Tails
(same recurrence, but different initial conditions)
and using it in some special cases
the input file
yields the output file
-
If you want to see two-variable linear recurrences (the same!) , in the number of desired Heads and the number of desired Tails, for the bi-variate prob. generating function according to the number of Heads and the Number of Tails
reach for the first time
- n Heads OR n Tails
- n Heads AND n Tails
(same recurrence, but different initial conditions)
and using it in some special cases
the input file
yields the output file
Pictures
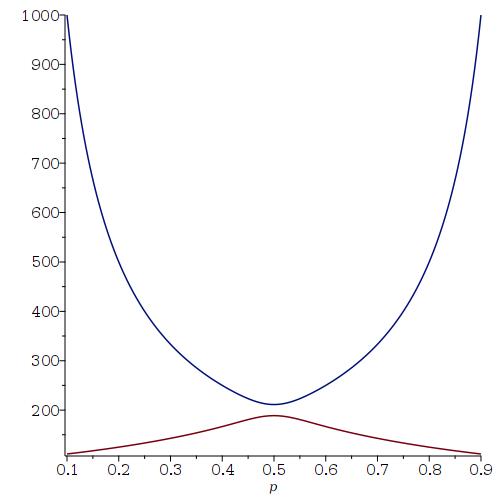
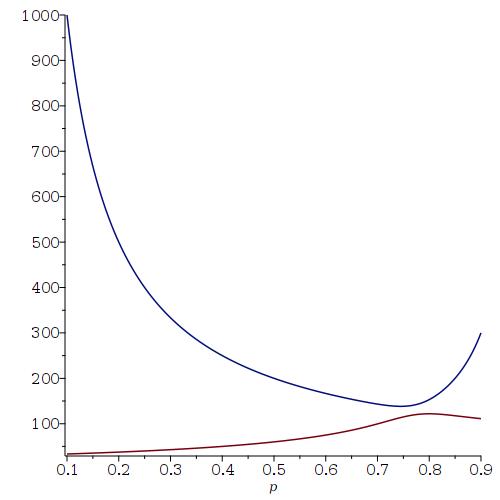
If you want to see a plot of the expected family size as a function of the Probability of having a boy (from 0.1 to 0.9) where
the goal is to have 100 boys AND (top) OR(bottom) 100 girls look here
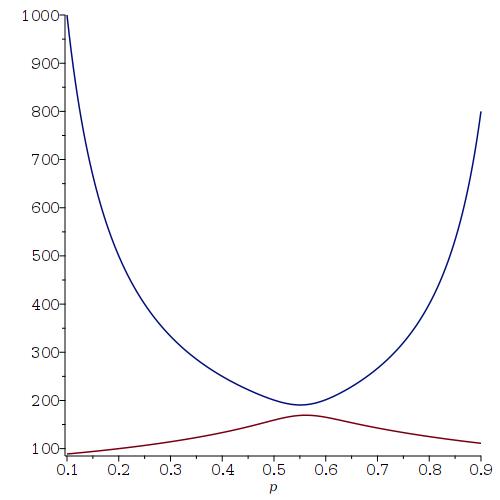
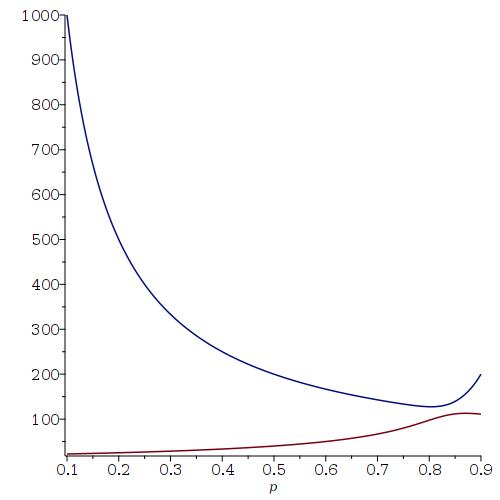
If you want to see a plot of the expected family size as a function of the Probability of having a boy (from 0.1 to 0.9) where
the goal is to have 100 boys AND (top) OR (bottom) 80 girls look here
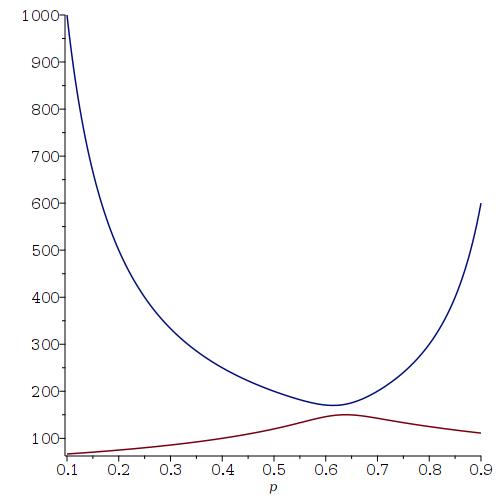
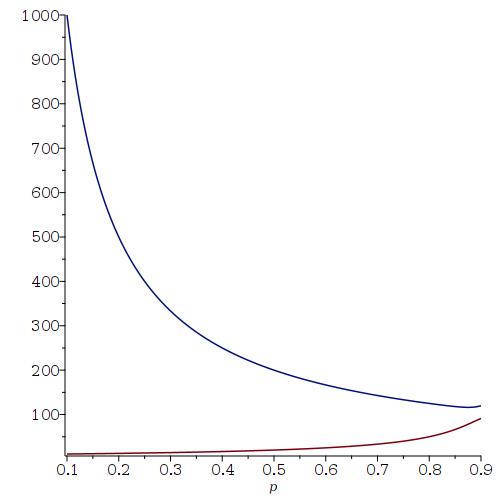
If you want to see a plot of the expected family size as a function of the Probability of having a boy (from 0.1 to 0.9) where
the goal is to have 100 boys AND (top) OR (bottom) 60 girls look here
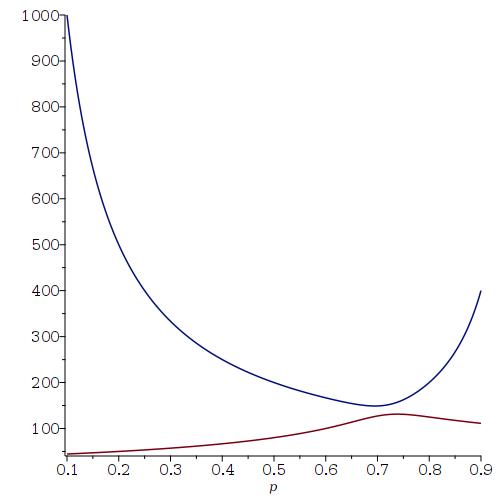
If you want to see a plot of the expected family size as a function of the Probability of having a boy (from 0.1 to 0.9) where
the goal is to have 100 boys AND (top) OR (bottom) 40 girls look here
If you want to see a plot of the expected family size as a function of the Probability of having a boy (from 0.1 to 0.9) where
the goal is to have 100 boys AND (top) OR (bottom) 30 girls look here
If you want to see a plot of the expected family size as a function of the Probability of having a boy (from 0.1 to 0.9) where
the goal is to have 100 boys AND (top) OR (bottom) 20 girls look here
If you want to see a plot of the expected family size as a function of the Probability of having a boy (from 0.1 to 0.9) where
the goal is to have 100 boys AND (top) OR (bottom) 10 girls look here
Articles of Doron Zeilberger
Doron Zeilberger's Home Page
Lucy Martinez's Home Page