By Svante Janson, Lucy Martinez and Doron Zeilberger
Written: Dec. 2025
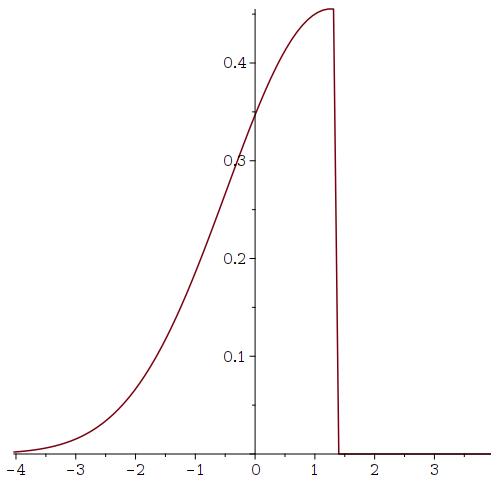
If you want to see a plot of the probability density function for the (scaled) discrete random variable "number of coin-tosses until a fair coin reaches either 200 Heads OR 200 Tails",see here (notice how one-sided it is, and it looks like the left side of the Normal Distrubtion.
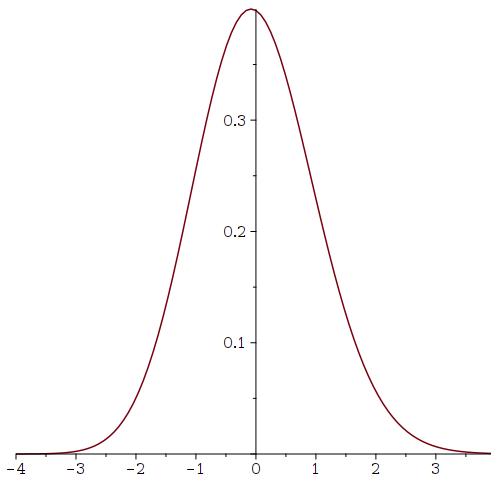
If you want to see a plot of the probability density function for the (scaled) discrete random variable "number of coin-tosses until a LOADED coin (prob. of Heads=1/3) to reach either 200 Heads OR 200 Tails", see here (notice how symmetric it is, and it looks like the full Normal Distrubtion.