The Approximate Risk-Averseness Graph for the St. Petersburg Gamble with 7 rounds and entrance fee 7, using the Central Limit Theorem Approximation
... If you are still here after 11 rounds , you toss a fair coin and if it lends Heads you win 2048 dollars, and exit. Hence With prob. (1/2)11=1/2048 you win 2048 dollars.
The probability table is now:
[[-9, 1/2], [-7, 1/4], [-3, 1/8], [5, 1/16], [21, 1/32], [53, 1/64], [117, 1/128], [245, 1/256], [501, 1/512], [1013, 1/1024], [2037, 1/2048], [2037, 1/2048]]
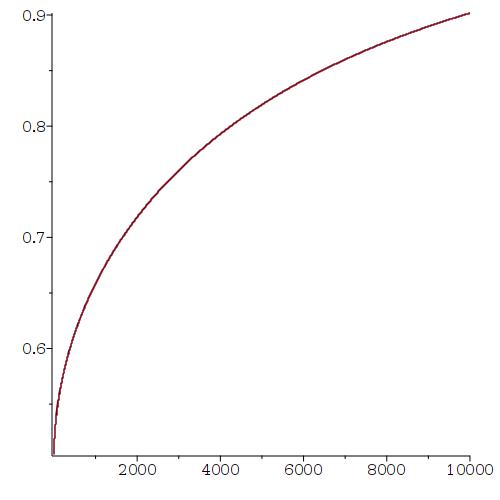
So the expected gain is one dollar, but the standard-deviation is 77.44675590 . Using the Central Limit Approximation, we get much faster, the graph of the approximate probability of not losing money if you insist on playing n times, for n from 1 to 2000.