One solution to a possible QotD for 10/29/2009
 Solution to a possible QotD for 10/29/2009
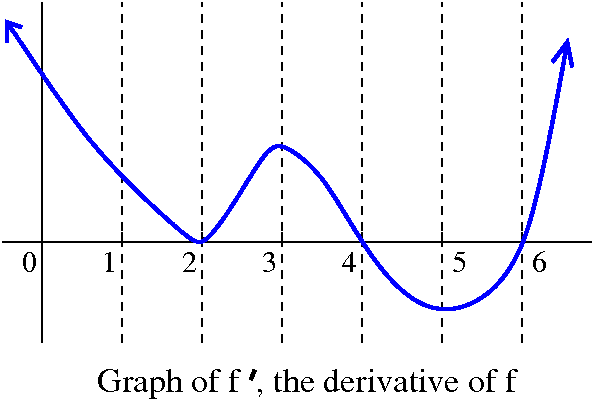
I've given a picture of the original graph to the right. This may help
you understand the discussion that follows.
- What are the critical points of f?
Since f´ has domain all of R, certainly the derivative exists at
every point. So critical points will occur exactly where
f´(x)=0. I look at the graph and read off x=2 and x=4 and x=5.
- In what intervals is f decreasing?
f is decreasing in intervals where f´(x)<0. The only
interval which qualifies is 4<x<6.
- In what intervals is f increasing?
f is increasing in intervals where f´(x)>0. Several intervals
qualify: (–∞,2) and (2,4) and (5,∞). It actually
turns out that f is increasing in the entire interval
(–∞,4) because just one point with a horizontal tangent
line doesn't "hurt" such behavior, but either answer would be accepted
by me as correct on an exam.
- For each critical point: is it a local max or a local min or
neither?
First, x=2: to the left, f is increasing since f´>0, and to
the right, f is increasing since f´>0. Therefore x=2 is
neither a local max nor a local min.
Now x=4: to the left, f is increasing since f´>0, and to
the right, f is decreasing since f´<0. Therefore x=4 is
a local max.
Finally, x=6: to the left, f is decreasing since f´<0, and to
the right, f is increasing since f´>0. Therefore x=4 is a
local min.
- Where is the graph of f concave up?
The graph of f is concave up in intervals where f´´>0.
If we consider the graph of f´ which is given, the "tilt" of the
tangent lines is up (so f´´>0) in the intervals (2,3) and
(5,∞). These are intervals where f´ is increasing.
- Where is the graph of f concave down?
The graph of f is concave down in intervals where f´´<0.
If we consider the graph of f´ which is given, the "tilt" of the
tangent lines is down (so f´´<0) in the intervals
(-∞,2) and (3,5). These are intervals where f´ is
decreasing.
- Where are the inflection points of f?
There are changes in concavity at x=2 and x=3 and x=5 so this is where the inflection points are located.
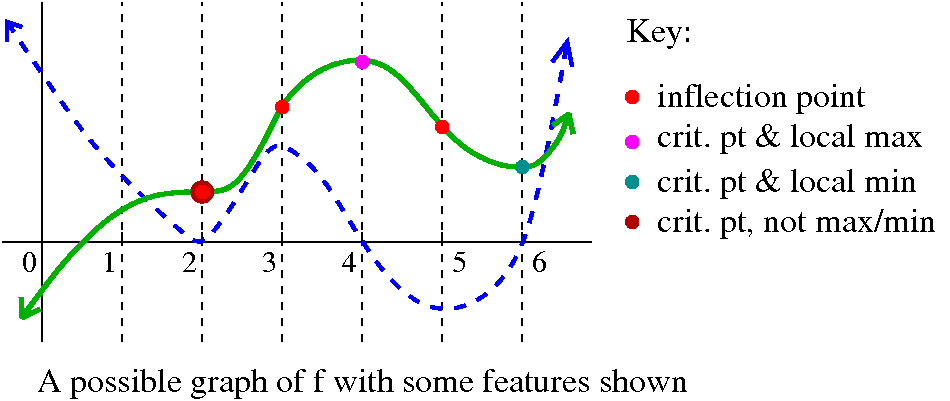
Here is one possible graph of f. As I mentioned, there are many
correct answers to this question. They all should present correct
{in|de}creasing behavior, correct concavity, correct local behavior at
critical points, and also correct inflection points.

Maintained by
greenfie@math.rutgers.edu and last modified 10/30/2009.
 Solution to a possible QotD for 10/29/2009
 Solution to a possible QotD for 10/29/2009