Domain and range and composition of functions
Students were asked to give a solution of the second problem for the
third workshop. The central aspect of this problem was consideration
of a complicated formula defining a function. The formula was a
composition of 4 (or maybe 5, depending on how you "read" it)
functions. Each piece was "easy" or (at least I hoped) would be well
known. These were:
ln arctan cubing (formula: x3) square root(ing) (formula:
sqrt(x) or x½) minus 1 (formula: x–1)
Based on the solutions I read, this was a very difficult
problem. I did not intend that the solution be so inaccessible and
intricate to write. Maybe here I can show some simpler examples of
composition and you can see what the difficulties are. The workshop
problem was quite intricate.
So let's look at the domain, range, and graphs of two functions, I
hope that what follows here is familiar. After this, we'll see some
examples of compositions and discuss what happens to the domains,
ranges, and graphs.
sine
The graph is periodic and repeats every 2Π. I
think this function should be familiar. |
Domain
All real numbers: R,
also written as (–∞,+∞). We can
input any real number.
| Range
The output from the "sine" function box (I'm sorry, I really do
think this way!) is restricted to numbers between –1 and 1,
including both end-points. So it is [–1,1].
| Graph
Or enough
of it to understand, I hope!

|
ln
There is nothing to the left of the y-axis, and the
stuff to the right is actually quite "simple" -- it just goes up, from
–∞ to +∞. I hope this also is familiar. |
Domain
We can only input
positive numbers. So the domain is (0,+∞). |
Range
The output for ln is
unrestricted: every real number is possible. So the range is
R or (–∞,+∞). |
Graph
Or enough
of it to understand, I hope!
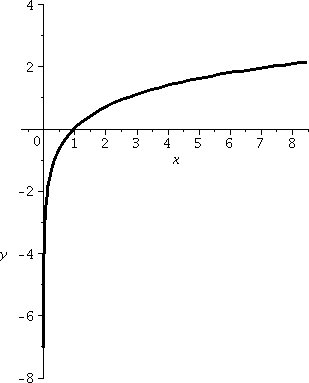
|
Now let's try working with these functions. I'll look at some
compositions.
sin(ln(x))
Well, the logical "flow" is something like this:
x→ln(x)→sin(ln(x). The first arrow imposes a restriction on
the domain. We'd better not feed in anything ≤0. The second arrow
will "take" anything because the domain of sine is all of
R. Therefore the domain of this composition is
(0,∞). What about the range? Since the output of ln is all of
R, the collection of inputs being "fed" to sine is all real
numbers. And we know that the collection of outputs for that
collection of inputs is [–1,1]. So I bet that the output of
sin(ln(x)), the range, is [–1,1].
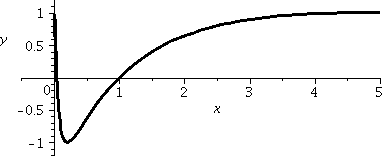 There's a picture of the graph of y=sin(ln(x)) to the right, but warning: this graph is actually much more complicated
and weird than what is shown in this picture. The graph is shown in a
rather conventional window, with x's ranging from 0 to 5 and y's from
–1 to 1. Much information is concealed. As x creeps close to 0
(in our notation, x→0–), ln(x) decreases and
decreases and decreases, and more and more negative numbers are given
as inputs to sine. But then sine oscillates. We get all of the outputs
corresponding to the inputs to sine of (-∞,0). There are more precise
pictures below, which are also more confusing.
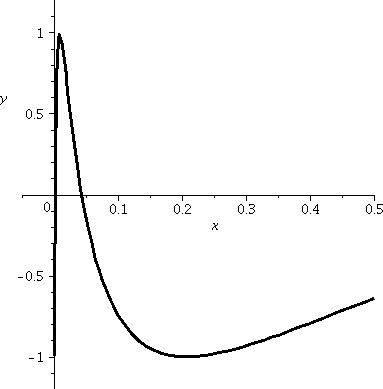
This is a less conventional window, and shows
what happens for x in the interval [≈0,.5].
|
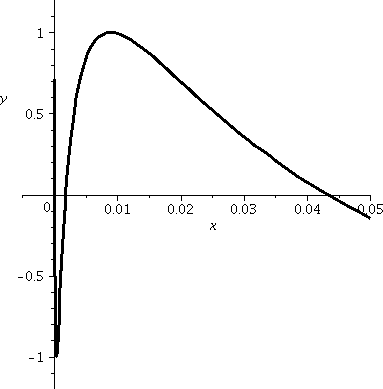
In this window, x is in [≈0,.05]. There is more wiggling up and
down as the inputs to sine march across multiples of 2Π.
In fact, there are infinitely many oscillations up and down to
the immediate right of 0. These are all of the oscillations of sine in
(–∞,0) sort of repackaged getting faster and faster as x→0+.
I think "oscillation" is more dignified than "wiggle"
but they mean the same.
|
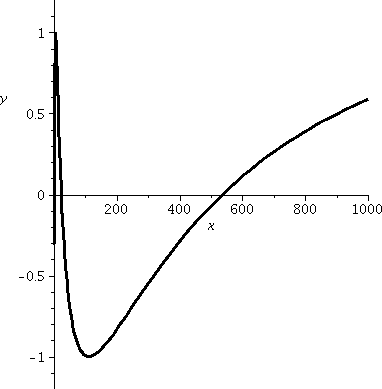
Well, here is the other side, and a vastly changed horizontal scale
(look closely, please). ln(x) increases as x→∞, and in fact
all positive real numbers eventually become outputs. Well, this means
that there are also infinitely many oscillations when x gets
large, but the waves are coming slower and slower. So the tops of the
bumps become farther and farther apart. So this is also a confusing
picture. These oscillations are all of the oscillations of sine in
(0,∞) sort of repackaged with a different clock, getting slower
and slower.
|
ln(sin(x))
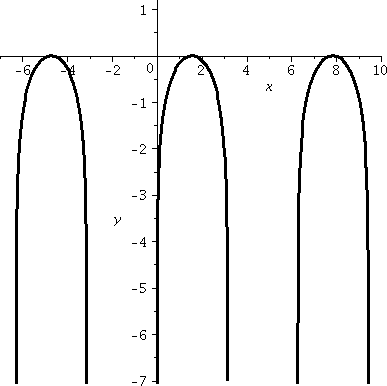 Let's try it this way: x→sin(x)→ln(sin(x)). Certainly there
is no restriction on inputs to sine, but there is a strong
restriction on inputs to ln: they must be positive. So every interval
where the values of sine (what I've been calling the outputs)
are not positive must be thrown out for this composition to be
defined. Let's see: in [0,2Π], sine is positive exactly in (0,Π)
(notice the end-points are not there!) so that the domain of
ln(sin(x)) includes the interval (0,Π).
Things repeat for every
multiple of 2Π since sine is periodic with period 2Π and
therefore the domain of ln(sin(x) includes (2Π,3Π) and
(4Π,5Π)and (6Π,7Π) etc. And, going the other way, the
domain also includes (–2Π,–Π) and
(–4Π,–3Π) etc. So the domain is this strange
collection of open intervals of length Π, each having distance Π
from the next piece of the domain.
But what is maybe more interesting is the range. The
values of sine on (0,Π) are just numbers from 0 to 1. To be
precise, these numbers are the interval (0,1]. When (0,1] gets fed
into ln, well, we only get as ouputs the values that
correspond to these inputs. I know that ln(1) is 0. And I know
that ln has all negative numbers as outputs for numbers between 0 and
1. So the outputs for this composition are (–∞,0]. The
composition ln(sin(x)) does NOT have the
same range as just ln. Its range is just (–∞,0], a much
smaller collection of numbers.
What should you get out of this, please?
Composition is very strange. Composition of functions can make
both the domain and the range of functions change in strange
ways. Below is a summary of what we've seen.
| Function | Domain | Range |
|---|
|
| sin(x) | (–&infin,∞)
| [–1,1] |
|
| ln(x) | (0,∞)
| (–&infin,∞) |
|
| sin(ln(x)) | (0,∞) | [–1,1] |
|
| ln(sin(x)) | (0,Π) and
all intervals gotten by "moving" this interval by integer multiples
(positive or negative) of 2Π | (–∞,0] |
Further comments
Students made interesting and helpful comments in class and after
class about this discussion. These comments were appreciated.
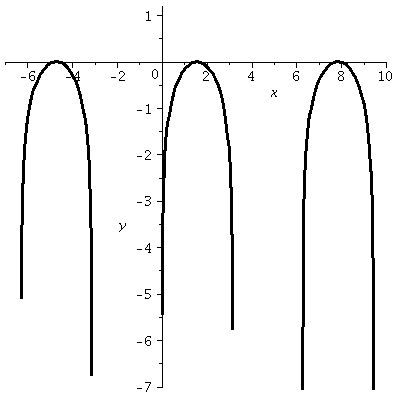 For example, Ms. O'Sullivan remarked
that her picture (on a graphing calculator) of y=ln(sin(x))
didn't look as regular and nice as the picture displayed above. This
is because (essentially) what a calculator does to display a graph is
evaluate the function at 87 equally horizontally spaced values in the
horizontal width of the window and then turn "on" or illuminate, as
well as possible, the pixels, locations on the calculator screen,
corresponding to those values. If the sample spacing doesn't agree
nicely with the multiples of Π which are important to the function,
then the picture will not look good or be related well to the actual
graph of the function. To the right is a graph gotten by sampling 87
values. You can see that the pieces of the curve don't look the
same. My graph above was not my first attempt to produce a
picture for these notes. I actually needed about a half-dozen
tries. The picture I used had a sample rate of about 350 points, and I
chose the window very carefully, so the picture looked like it
should! Technology is very powerful, but computers generally do
exactly what they are told to do. Sometimes care is needed!
Another student (whose name I unfortunately do not know) discussed the
workshop problem with me after our analysis of the functions here. The
workshop problem asks for the domain and range of (arctan(ln(sqrt(x)-1)))3. He said that maybe
he could only "worry" about arctan and cubing. My comment was that
a writeup which explained the solution to the problem would need to
consider all of the "pieces" of the composition, and that the
explanation would need to be rather careful. In the two simpler
compositions discussed here, I tried to explain how considerations of
domain and range needed us to consider both functions involved and how
these functions interacted with each other. This interaction provides
most of the irritating features (sorry, "interesting aspects" might be
a more diplomatic phrase) of the example. So for the workshop problem,
some discussion of the interaction of each part of the composition is
necessary.
Maintained by
greenfie@math.rutgers.edu and last modified 10/2/2009.


 There's a picture of the graph of y=sin(ln(x)) to the right, but warning: this graph is actually much more complicated
and weird than what is shown in this picture. The graph is shown in a
rather conventional window, with x's ranging from 0 to 5 and y's from
–1 to 1. Much information is concealed. As x creeps close to 0
(in our notation, x→0–), ln(x) decreases and
decreases and decreases, and more and more negative numbers are given
as inputs to sine. But then sine oscillates. We get all of the outputs
corresponding to the inputs to sine of (-∞,0). There are more precise
pictures below, which are also more confusing.


 Let's try it this way: x→sin(x)→ln(sin(x)). Certainly there
is no restriction on inputs to sine, but there is a strong
restriction on inputs to ln: they must be positive. So every interval
where the values of sine (what I've been calling the outputs)
are not positive must be thrown out for this composition to be
defined. Let's see: in [0,2Π], sine is positive exactly in (0,Π)
(notice the end-points are not there!) so that the domain of
ln(sin(x)) includes the interval (0,Π).
Things repeat for every
multiple of 2Π since sine is periodic with period 2Π and
therefore the domain of ln(sin(x) includes (2Π,3Π) and
(4Π,5Π)and (6Π,7Π) etc. And, going the other way, the
domain also includes (–2Π,–Π) and
(–4Π,–3Π) etc. So the domain is this strange
collection of open intervals of length Π, each having distance Π
from the next piece of the domain.
  For example, Ms. O'Sullivan remarked
that her picture (on a graphing calculator) of y=ln(sin(x))
didn't look as regular and nice as the picture displayed above. This
is because (essentially) what a calculator does to display a graph is
evaluate the function at 87 equally horizontally spaced values in the
horizontal width of the window and then turn "on" or illuminate, as
well as possible, the pixels, locations on the calculator screen,
corresponding to those values. If the sample spacing doesn't agree
nicely with the multiples of Π which are important to the function,
then the picture will not look good or be related well to the actual
graph of the function. To the right is a graph gotten by sampling 87
values. You can see that the pieces of the curve don't look the
same. My graph above was not my first attempt to produce a
picture for these notes. I actually needed about a half-dozen
tries. The picture I used had a sample rate of about 350 points, and I
chose the window very carefully, so the picture looked like it
should! Technology is very powerful, but computers generally do
exactly what they are told to do. Sometimes care is needed!