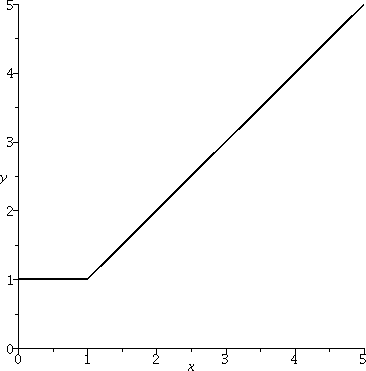
Part b) brings up the function defined by the expression max(1,x). Here is a graph of this function on the interval [0,5].
I don't want to kill the problems (from my pedagogical point of view!) by writing solutions to them in this diary. But I will give some amplification of the classroom discussions by displaying some appropriate graphs.
|
Problem 1 b) Part b) brings up the function defined by the expression max(1,x). Here is a graph of this function on the interval [0,5]. |  |
|
Problem 1 a) And the answer to part a) makes me think of the two-variable function f(x,y)=max(x,y). Here is a graph (in three dimensions -- you'll appreciate it more next semester) of the function z=f(x,y) for x and y both between 0 and 2. | 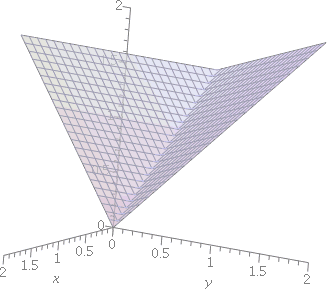 |
|
Problem 2 So here is a grpah showning two curves on the interval [1,100]. One of them is ln(x) and the other is 210(x(1/210)–1). They overlay one another so closely that, to me, only one "curve" is consistently visible. | 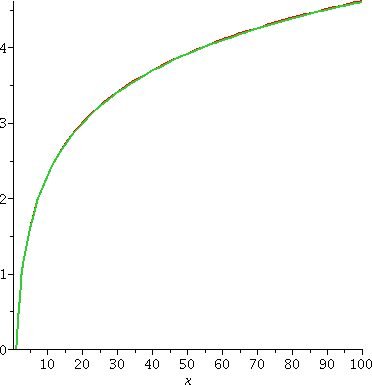 |
|
Problem 2 (another attempt) Here are the same two functions on the interval [90,100]. The functions get separated more as the distance to 1 increases (similar to partial sums of most Taylor series). Now you can "see" the two curves. | 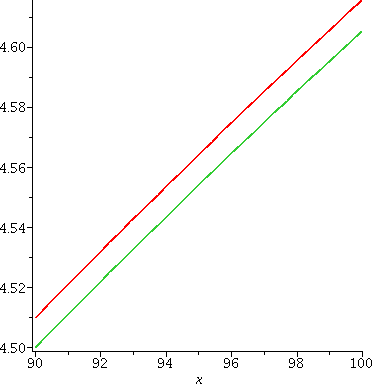 |
|
Problem 5 Here is a graph of the function e2cos(x)(cos(2sin(x)) on the interval [0,20]. You can compare this with the partial sum given in the problem statement. If this graph doesn't convince you that complex numbers exist (at least as much as the numbers sqrt(2) and Π "exist") then I don't know what argument would. | 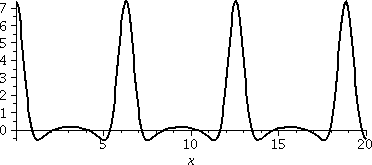 |
|
Problem 7 Here is a graph of J0, a Bessel function of the first kind on the interval [0,10]. | 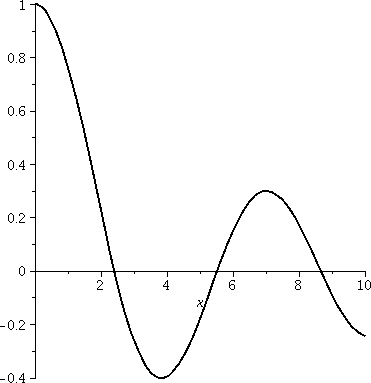 |
Preparation for the final exam
Please see this file. I'll discuss
whether you want a formal review session or office hours or
whatever. The balance of class time this week will be devoted to
further observations about power series.