r=cos(3 )
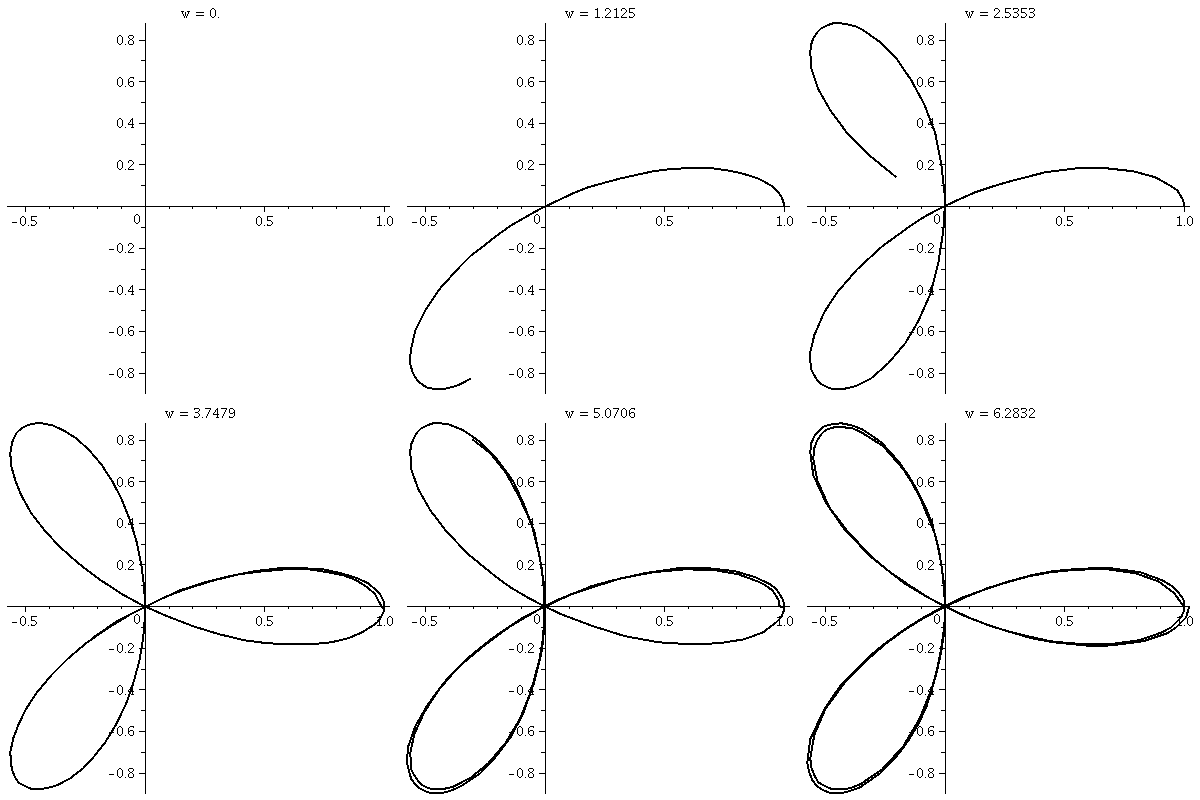
This is a three-leafed rose. Please note that the graph shows one
sweep, as )
This is a three-leafed rose. Please note that the graph shows one
sweep, as  goes from 0 to
2Pi. goes from 0 to
2Pi.  The rectangular graph, shown here, has three pairs of ups and downs. The polar trace covers the leaves twice. The six up-and-downs of
cos(3
 ) (magically?) reduce to
retracings of half of the loops. I hope I made this
evident. I introduced some deliberate distortion in the second
tracing. Without the distortion, the second tracing could not be seen
at all, since the pixels the "point" travels over and colors all had
already been colored. ) (magically?) reduce to
retracings of half of the loops. I hope I made this
evident. I introduced some deliberate distortion in the second
tracing. Without the distortion, the second tracing could not be seen
at all, since the pixels the "point" travels over and colors all had
already been colored.
| 
|
 The rectangular graph, shown here, has three pairs of ups and downs. The polar trace covers the leaves twice. The six up-and-downs of
cos(3
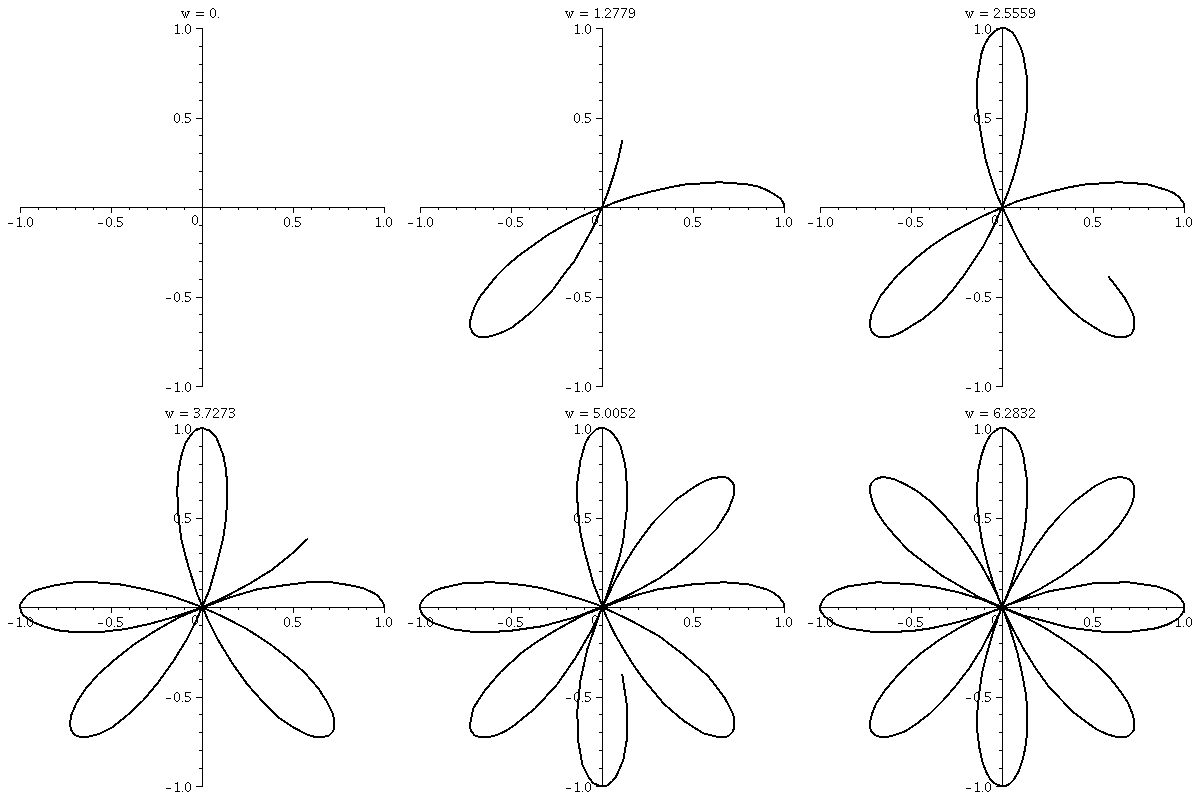
 The rectangular graph. to the right, shows four bumps up and four bumps
down. There are no retracings of already
colored points, so that the wiggles up and down of cos(4