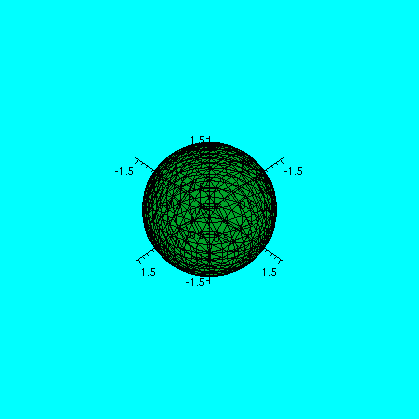
| A:=implicitplot3d(x^2+y^2+z^2=1, x=-1.5..1.5, y=-1.5..1.5,
z=-1.5..1.5,
color=brown, axes=normal, scaling=constrained, grid=[20,20,20]):
|
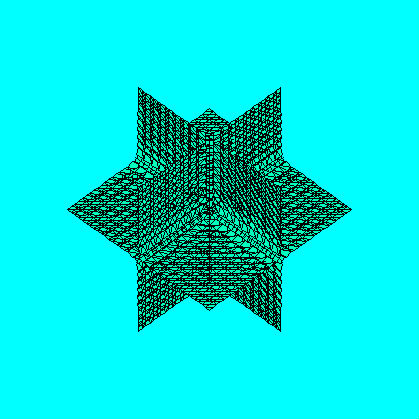
implicitplot3d(x*y*z=0, x=-1.75..1.75, y=-1.75..1.75,
z=-1.75..1.75, color=pink, axes=normal, scaling=constrained,
grid=[20,20,20]);
|
|
|
| Picture #1 | Picture #2 |
|---|
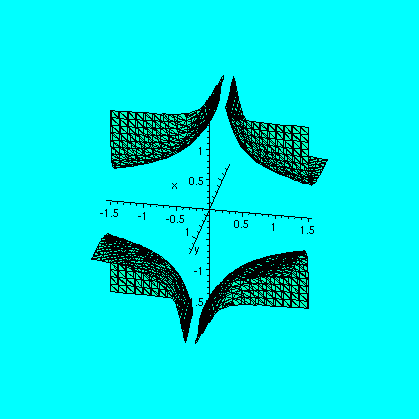
TURF:=v->implicitplot3d(x*y^2*z^3=v, x=-1.8..1.8, y=-1.8..1.8,
z=-1.8..1.8, color=blue, axes=normal, scaling=constrained,
grid=[25,25,25]);
TURF(-.05);
|
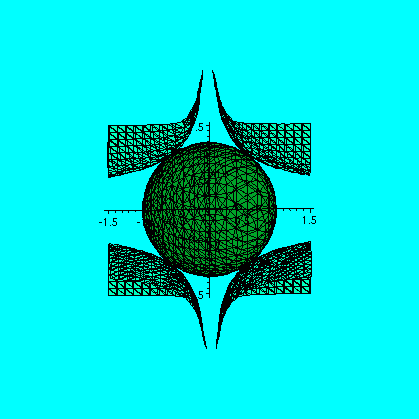
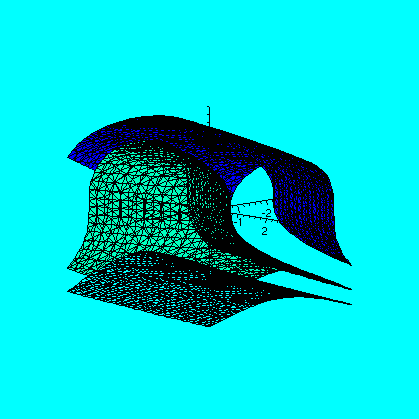
display3d({A,TURF(-sqrt(3)/36)});
|
|
|
| Picture #3 | Picture #4 |
|---|
SURF:=(v,w)->implicitplot3d(x+y^2+z^3=v, x=-2.5..2.5, y=-2.5..2.5,
z=-2.5..2.5, color=w, axes=normal,
scaling=constrained, grid=[25,25,25]);
Here I made the Maple function depend both on the constant
for the level surface, and the color. That's so I could vary the color
easily in the next display.
display3d({SURF(6,green), SURF(.5,pink), SURF(-5,yellow)});
|
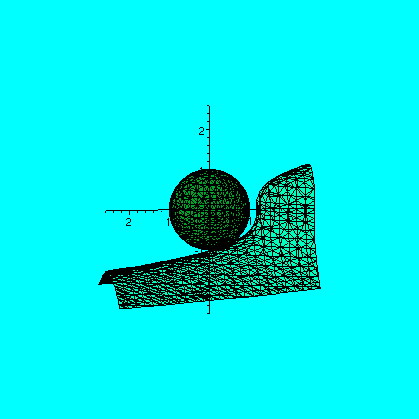
display3d({A,SURF(-1.17205,pink)}); |
|
|
| Picture #5 | Picture #6 |
|---|
| display3d({A,SURF(1.25,pink)}); |
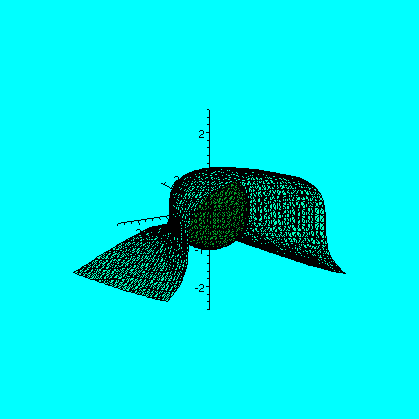
|
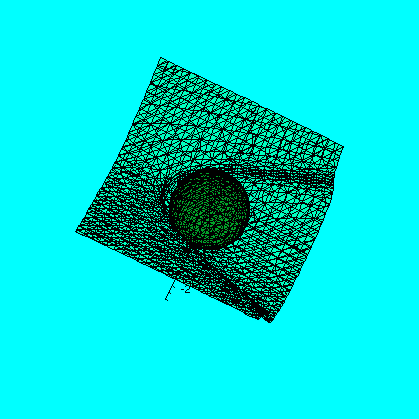
|
| Picture #7 | Picture #8 |
|---|
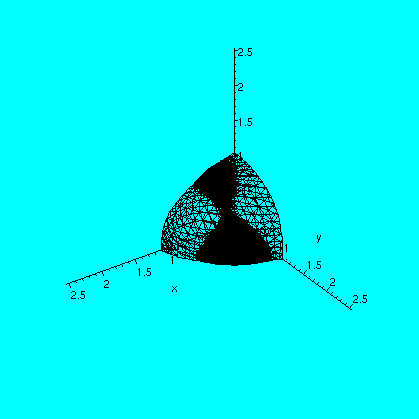
LA:=implicitplot3d(x^2+y^2+z^2=1, x=0..1.5, y=0..1.5, z=0..1.5,
color=blue, axes=normal, scaling=constrained, grid=[30,30,30]):
LSURF:=v->implicitplot3d(x+y^2+z^3=v, x=0..2.5, y=0..2.5, z=0..2.5,
color=yellow, axes=normal, scaling=constrained, grid=[30,30,30]);
display3d({LA,LSURF(1.102)});
|
|
| Picture #9 |
|---|


