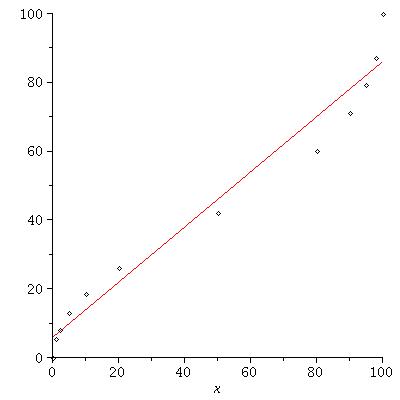
The horizontal axis is the actual probability of the event. The vertical axis is the "decision weight", i.e. the "gambling estimate". For perfectly rational gamblers, it should be the line y=x.
The data is:
[[0, 0], [1, 5.5], [2, 8.1], [5, 13.2], [10, 18.6], [20, 26.1], [50, 42.1], [80, 60.1], [90, 71.2], [95, 79.3], [98, 87.1], [100, 100]]
The line is
y= 5.827286892 + 0.8010391240 x
back to Math 250(02), Fall 2018 page