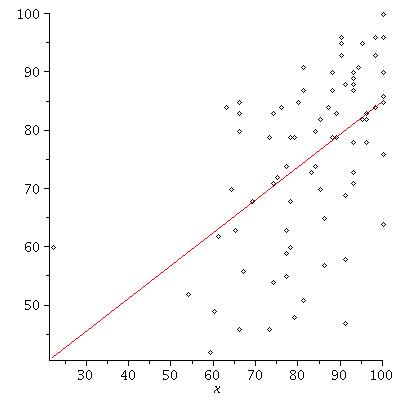
Scatter plot and best line for Exam 1 vs. Exam 2 scores
This is a scatter-plot, of students' scores on exam I vs. their score on exam II.
These exams were taken by the 79 students in Dr. Z.'s class, Math 250 (02), Fall 2018, (Rutgers University)(NB).
It illustrates the method of Least Squares, covered in Lecture 23 (Dec. 6, 2018).
The least-squares line is
y= 28.63329325 + 0.5633950740 x

back to
Math 250(02), Fall 2018 page

