In Spring 2001, the Rutgers mathematics department introduced a computer-based homework system into its non-science calculus course, Math 135. This system used WeBWorK, which was developed with NSF financing at the University of Rochester. Its introduction at Rutgers was made possible by a Rutgers Internal Technology Initiative, funded by a grant from the Mellon Foundation.
In this study, we try to measure how effective WeBWorK was in improving learning, measured by the students' performance in calculus. Our procedure was to treat the Fall 2001 course as a controlled experiment, using the score on the common final exam as a measure of performance. The final exam scores ranged from 0 to 200 points.
This was possible because the transition to WeBWorK was gradual, and the course is coordinated to ensure a common syllabus as well as a common final exam. During the Fall 2001 semester, about two-thirds of the 1334 students were in sections requiring weekly WeBWorK assignments. The selection of which sections should require WeBWorK was invisible to the students, and was somewhat random. This made it possible to treat the non-WeBWorK sections as a control group. The first hypothesis being tested was that WeBWorK is effective in raising scores on the final, i.e., in enhancing student performance.
It quickly became apparent that three sub-populations of students had different profiles. First-year students made up the largest sub-population (62% of everyone); they responded much better to WeBWorK than upper-class students. A second type of student, which we shall refer to as "non-repeaters," consisted of upper-class students who were taking calculus for the first time. The third sub-population consisted of students who were repeating the course; we shall refer to them as the "repeaters."
Table 1 displays the average final exam scores for the control group
and the WeBWorK sections, along with a breakdown by sub-populations.
The corresponding letter grades are given as a guidline.
Over all students (line 1 in the table), the average final was 8
points higher in WeBWorK sections than in the control sections, which
is significant at the 95% confidence level, because the standard error
of the mean is about 2.1. However, the control/WeBWorK differences
within the sub-populations were not statistically significant.
| Type of student | Control Sections | WeBWorK Sections | Std. Error | WW>80% | WW<50% | |
|---|---|---|---|---|---|---|
| All students | 130.7 (C+) | 138.1 (C+) | 2.1 | 156.5 (B) | 107.2 (C) | |
| First-year students | 147.4 (B) | 150.1 (B) | 2.5 | 161.1 (B+) | 119.8 (C) | |
| Non-repeaters | 114.3 (C) | 114.4 (C) | 4.0 | 138.7 (B-) | 95.1 (D) | |
| Repeaters | 102.1 (C-) | 107.4 (C-) | 6.1 | 110.4 (C) | 97.5 (D) | |
Table 1: Mean FINAL Exam Scores, for Control and WeBWorK groups
On the other hand, if we restrict to students who did at least 80% of all WeBWorK assignments, the averages rise dramatically. Similarly, if we restrict to students who did at most 50% of all WeBWorK assignments, the averages drops dramatically (except for repeaters). One way of stating these observations is this:
Just being in a WeBWorK class is not enough; students must actually do the assignments in order to reap the benefit on the final. However, there was a statistically significant difference of half a letter grade between students in the control group, and students who were not only assigned WeBWorK problems but attempted them.
In WeBWorK sections, the dominant predictors of final exam score in
WeBWorK sections were the Precalculus placement score and WeBWorK
score. In the Control group, the dominant predictor of final exam
score was the Precalculus placement score. The effect of WeBWorK
varied dramatically from population to population.
2. Upper-class students who are taking calculus for the first time.
These students are likely to correctly solve only half of the
WeBWorK problems. Nevertheless, here is a strong correlation (0.56)
between WeBWorK scores and final exam scores. There is also a 3-letter
grade difference (on the average, from B to F) between students who do
well on WeBWorK and those who do not attempt it.
This is illustrated by Figure 5b.
3. Students who are repeating calculus. These students do not usually
attempt many WeBWorK problems, even though it counts towards their course
grade. Even those who do attempt WeBWorK do not seem to benefit from it.
This is illustrated by Figure 5c.
There is a very weak correlation (0.21) between WeBWorK scores and
final exam scores, and no correllation between WeBWorK and skill level.
4. There are no significant gender differences between the men and
women in our sample. This is illustrated by the scatterplots in
Figures 7 and 7a.
There was a weak correlation between WeBWorK performance and placement
scores (.23 for first-year students, .14 for non-repeaters and
.05 for repeaters). This suggests that a high precalculus skill level helps
students do well on WeBWorK, but it cannot be used to predict how well.
The number of students taking the final exam is given by table 2.
We divided the students into four groups, according to the class format.
The control group ('C') consisted of 296 students (25%) in the
regular class format, with no web-based homework. The WeBWorK group
('W') consisted of 715 students (62%) in the regular class format,
with web-based homework. There was a third group ('M') of 72 students
(6%) who switched to WeBWorK in the middle of the semester, and a
fourth group ('S') of 76 students (7%) in the small practicum sections, who
did no web-based homework.
For the purposes of this report, the performance of mixed group M and the
small practicum group S were not relevant. In addition, their small size
meant that little could be concluded about their behaviour. Therefore
the bulk of this report will focus upon the Control Group C and the
WeBWorK group W.
Here is a table showing how differently these
sub-populations performed, both on WeBWorK and on the FINAL exam.
TOTAL is the percentage of all WeBWorK problems completed, and the
FINAL score is out of 200 points. We have attached letter grades to
the FINAL scores for calibration purposes; below 90 points was failing.
Each week, students log on to WeBWorK and are given a set of homework
problems. The problems are similar but slightly different for each student.
They can collaborate in
finding solutions, but they still need to answer their own individual
problems. When they are ready, they enter their answers into the
computer. WeBWorK immediately tells students if their answers are
correct, but does not tell them the correct answers. They are allowed
to try to answer the same question again, until they get it right.
Most students get a correct answer within 3 tries; it is rare for a
student to try more than 10 guesses, and then get the right answer.
To measure WeBWorK performance, we used a variable called TOTAL, which
is the percentage of all WeBWorK problems solved correctly.
Although we had detailed information about each of the ten WeBWorK
problem sets, all of it was highly correlated. The correlation between
the number of sets attempted and TOTAL was a remarkable .944; the
correlation between TOTAL and any individual set ranged from .70 to .88,
which is also very high. With a few exceptions,
the correlation between scores on any two sets ranged from .63 to .75.
Our analysis of variance showed that TOTAL was a more significant predictor
of final exam score than the number of attempts, or other combinations
we tried.
It is important to understand that most students in WeBWorK sections
did most of the WeBWorK problems. About 11% of students in these sections
did not attempt WeBWorK at all; many of these dropped the course,
and hence did not take the final exam. (See bar chart 4 below.)
Excluding these, about a third had a WeBWorK TOTAL of under 50%,
a third had a TOTAL between 50 and 90%, and a third had a TOTAL over 90%.
Do the better prepared students do better at WeBWorK?
To answer this question, we did an analysis of variance, using the
WeBWorK TOTAL as dependent variable. Among the 380
first-year students in WeBWorK sections, the best numerical predictors
were High School rank and Precalculus placement score. However these
predicted only 9% of the variance in the WeBWorK totals. As
illustrated in Tables 1 and 3, the best predictor was the student's history:
first-year, upper-class non-repeater or repeater.
For the entire population, the most significant predictor was the WeBWorK
TOTAL, with a regression of FINAL = 82.7 + (.81)TOTAL. According to the
R-squared value, this accounted for 38% of the variability in the data.
Although this predicts a swing of 3-1/2 letter grades, from 83 points (F)
for no WeBWorK to 164 points (B+) for all WeBWorK, our more detailed
analysis below shows that this is not a good interpretation.
In fact, the data suggests a quadratic relationship between
the WeBWorK TOTAL and the FINAL Exam score, with the best-fitting curve
being concave up. That is, students who do less than 50% of the
WeBWorK get less "marginal" benefit on the final (improvement
from doing one more problem) than students who do over 80% of the
WeBWorK. To estimate this relationship, it is convenient to express the
WeBWorK score as a fraction T (from 0 to 1) rather than as TOTAL,
which is a percentage. That is, T = TOTAL/100. (See figure 5.)
The best-fitting quadratic polynomial to the data for all 802 students was:
FINAL = 90 + 30*T + 43*T^2.
For upper-class students taking calculus for the first time, the WeBWorK
TOTAL was also the most significant predictor of the final exam score,
accounting for 34% of the data variability. The least-squares fit
for this group was FINAL = 68.3 + (.77)TOTAL.
Although this predicts a swing of 3 letter grades from 68 points (F)
for no WeBWorK to 145 points (B) for all WeBWorK, this is not a good
interpretation either.
Our previous study had shown the importance of the Precalculus placement
score, PCAL, which is administered to all incoming Rutgers students.
PCAL is measured on a scale of 0-35 points; incoming students cannot
take calculus unless PCAL was at least 21 points. As in our previous
study, we included many other variables (gender, SAT scores, etc.) in
an analysis of variance, and recovered our previous finding
that the other variables were not significant.
Here are the results of our regressions between PCAL and FINAL.
These results are consistent with our previous findings. See the
Appendix for a justification of these regressions.
This data shows no statistically significant difference between
students in WeBWorK sections and students not in WeBWorK sections,
even those with similar precalculus skills. One explanation for this
is that just being in a WeBWorK section did not mean that a
student actually used the WeBWorK.
To test the effect of WeBWorK we
had to combine the placement score (PCAL) with the WeBWorK score (TOTAL).
FINAL = 41.5 + (2.32)PCAL + (.61)TOTAL
FINAL = 18 + (3.26)PCAL + (.59)TOTAL
In order to compare this model with the data from the control group,
we adjusted the final score by subtracting off the
best fit for all first-year students from Table 6, setting:
ADJ.FIN = FINAL - (46.2 + 3.93*PCAL).
FINAL = 51 + (1.45)PCAL + (.71)TOTAL
A similar least-squares fit, with the Rutgers Precalculus Placement
score replaced by the Math SAT score, gave almost identical results.
Perhaps this is not so surprising, since the correlation between
Math SAT and placement scores was a high .66.
In order to visualize the effect of WeBWorK upon final exam scores,
we adjusted the final by subtracting off the best fit for all upper-class
non-repeating students from Table 6, setting:
AD.FIN2 = FINAL - (80.8 + 2.2*PCAL).
In order to plot final exam scores versus WeBWorK scores, we adjusted
the final exam score by substracting off the best placement fit. That is
AD.FIN2 = FINAL - (61.6 + 2.2*PCAL). A visual inspection of Figure 8c
(which resembles Figure 4c) shows that there is almost no connection
between WeBWorK score and performance on the final, even after adjusting
for placement scores.
The most important factor was a combination of many variables, including the
Math SAT (scaled from 200 to 800). Associated to this factor is a new
predictor, which we christened "NEWP." By definition:
NEWP = 0.0582*MSAT + 0.738*PCAL + 0.635*TOTAL.
The second factor was essentially a combination of High School Rank (HSR)
and the WeBWorK TOTAL:
(FINAL, MSAT, PCAL, HSR, TOTAL) = (.33,-.27,.00,.40,.50)
The statistical assumptions used to justify least squares regressions
in one variable are that:
Since the analyses of residuals were similar in each case, we will only
describe the analysis for one case, the population of 719
first-year students in either the control or WeBWorK groups.
The variable ADJFINAL = FINAL - (46.2 + 3.93*PCAL) used in the study
is essentially the residuals in this case (where the least-squares fit is
46.0+3.937*PCAL). Chart A1 shows the frequency distribution for the
residuals; it is close to a normal distribution with standard deviation 30,
but is skewed slightly right (Skewness -1.0) and has a longer left tail
(Kurtosis 1.95) than expected.
To check homoscedasticity, we consider the quartile-quartile (QQ) plot
of the residuals against the normal distribution. It is a good fit
for students within two standard deviations of zero, but breaks down
for the 5% of students at the low extreme. It is somewhat truncated at
the high extreme because of the cap (a perfect score of 200) on the final
exam score, FINAL.
The verification of normality and homoscedasticity for the regression
of FINAL against WeBWorK score (TOTAL) is similar. Figure A3 shows the
quartile-quartile (QQ) plot of the residuals against the normal distribution.
For least squares regressions with two or more variables,
such as the regression above of FINAL against
PCAL and TOTAL, there is one additional assumption:
We would like to thank Prof. S. Geller of Texas A&M University for
several discussions about the statistical methods we have used in this study.
[WH] L. Hirsch and C. Weibel,
Effectiveness of Rutgers' Calculus Formats - Part II, 2000.
Findings
The availability of WeBWorK does not help students
unless they use it.
Students in WeBWorK sections did slightly better than the control group.
However, within WeBWorK sections, students who did over 80% of the WeBWorK
problems performed dramatically better (by a full letter grade) than
those who did less than half of the
WeBWorK problems. There was no significant distinction between the percentage
of WeBWorK problem sets attempted and the percentage of problems
solved correctly.
1. First-year students in Calculus.
These students are very responsive to WeBWorK, and most attempt
every problem. There is a strong correlation (0.55) between
WeBWorK scores and final exam scores. After adjusting
for placement scores, there is a 2-letter grade difference (on the average,
from B to D) between students who do well on WeBWorK and those who do
not attempt it. This is illustrated by the scatterplots in
Figures 7 and 7a.
Grouping by Class Format
In Fall 2001, we had 1334 students take the common final exam, and
had more complete data for 1159 students. Students were taught in two class
formats, with and without WeBWorK. The regular class format consisted
of two 80-minute lectures and one 55-minute recitation each week. The
"practicum" class format consisted of small classes, two 80-minute
lectures and two
55-minute recitations each week, one for homework and one for workshops.
Type of Student ALL
C W M S
First-year students 857
202 553 44 58
Non-repeaters 286
91 155 25 15
Repeaters 102
40 51 8 3
Unknown status 89
35 48 5 1
totals 1334
368 807 82 77
Table 2: Number of students, by type and group
C=control group; W=WeBWorK sections; M=switched mid-semester; S=small practicum
Type of student number TOTAL % FINAL
All students 936 (100%) 63.9
138.1 (C+)
First-year students 583 (62%) 75.8
147.4 (B)
Upper-class non-repeaters 211 (23%) 46.6
114.5 (C)
Unknown status 68 (7%) 47.2 110.2 (C)
Repeaters 74 (8%) 34.4 102.1 (C-)
Table 3: WeBWorK TOTAL and FINAL Exam means
(students in WeBWorK sections)
At one extreme we have first-year students; they did most of the WeBWorK
problems and also did well on the final exam. At the other extreme we have
repeaters; they did only a third of the WeBWorK on average,
and also did poorly on the final exam.
What WeBWorK is
WeBWorK is a web-based homework checker, allowing calculus students to
get feedback on weekly problem sets. Dozens of math departments in the
United States use some form of WeBWorK, including Rutgers.
The original model of WeBWorK was created in 1996 at
the
University of Rochester.
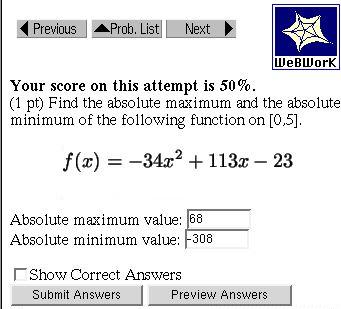
Sample WeBWorK problem.
The score is 50% because one answer is wrong.
Bar Chart 4: Distribution of WeBWorK TOTAL scores
WeBWorK is the most significant predictor
An analysis of variance was performed on each sub-population within
WeBWorK sections, in order to
find the most significant predictors of performance on the final exam.
The variables we considered included: WeBWorK score, Precalculus placement,
SAT scores (Math and Verbal), High School rank, and gender.
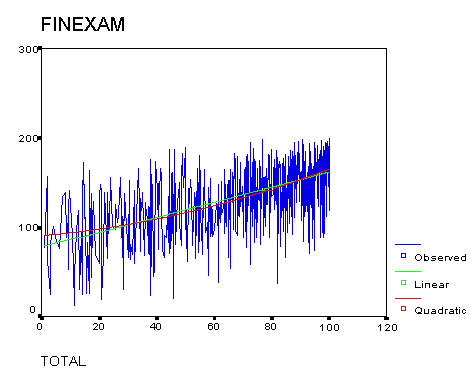
Figure 5: Final Exams versus WeBWorK TOTAL
(best linear and quadratic fits, all students)
This means that the difference between doing one WeBWorK set (T=.1)
and two sets (T=.2) would be only 4 points on the final (from 93 to 97),
while the difference between doing 9 sets and all 10 WeBWorK sets would
be 12 points on the final (from 151 to 163).
WeBWorK for First-year Students
For the first-year students, the most significant predictor was the WeBWorK
TOTAL, with a regression of FINAL = 103.8 + (.62)TOTAL. According to the
R-squared value, this accounted for 25% of the variability in the data.
Although this predicts a swing of 3 letter grades from 104 points (C)
for no WeBWorK to 176 points (A) for all WeBWorK, this is not a good
interpretation either. (See figure 5a.)
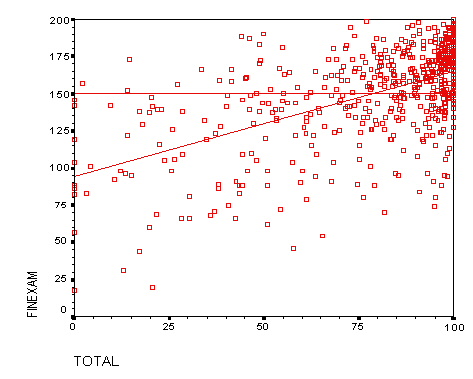
Figure 5a: Final Exams versus WeBWorK TOTAL
(first-year students)
Note that the data is skewed to the right, with an average WeBWorK
TOTAL of 75.8 and a standard deviation of 28.5.
WeBWorK for Upper-class Non-repeaters
Another interesting population consisted of upper-class students who
were taking calculus for the first time at Rutgers, students we refer
to as non-repeaters. This was a more diverse group.
Only 11% of these students had originally placed into calculus;
presumably they didn't take calculus in their first year because of
other course priorities. Another 43% placed into Precalculus, and 32%
placed below precalculus; these students had therefore already taken
some college-level mathematics courses, at Rutgers or elsewhere.
The remaining 14% consisted of transfer students who did not take the
placement tests.
Figure 5b is a scatterplot showing the least-squares fit.
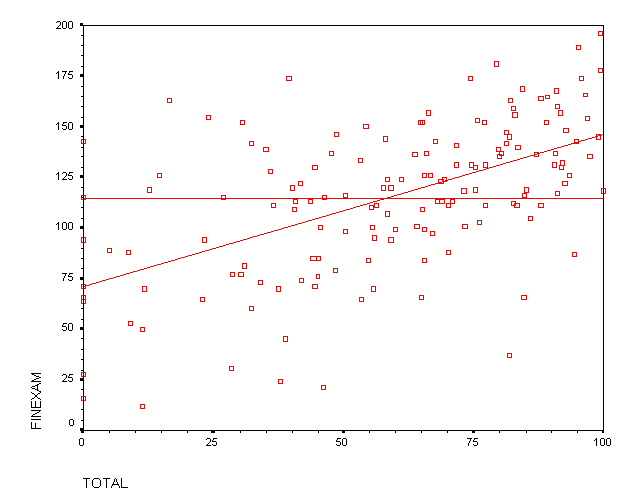
Figure 5b: Final Exams versus WeBWorK TOTAL
(upper-class non-repeating students)
WeBWorK for Repeaters
For students repeating calculus, there was almost no connection between
WeBWorK score and performance on the final. In fact, the least-squares
fit is almost meaningless, accounting for only 4% of the vaiance in
the data. This is vividly illustrated by the scatterplot in figure 5c:
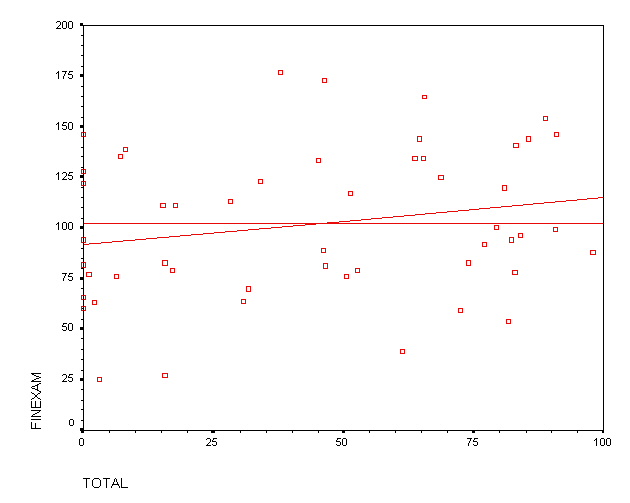
Figure 5c: Final Exams versus WeBWorK scores
(students repeating calculus)
The Final Exam versus Precalculus Placement
We next performed a comparison to our previous
study [WH] (in 2000) of teaching effectiveness in this class.
The performance of each student was measured by their score, FINAL, on the
common final exam. This was a 3-hour exam given at the end of the semester,
and graded on a scale of 0-200 points. The median FINAL score was 128.
We found that the overall distribution of FINAL scores was very similar to the
distribution described in our previous study [WH].
Type of Student/Group PCAL MSAT FINAL
FINAL vs PCAL
All students 22.4 622 135.4
F = 64.1 + (3.19)PCAL
Control Group C 21.6 617 130.7
F = 64.0 + (3.11)PCAL
WeBWorK Group W 22.8 624 138.1
F = 64.0 + (3.25)PCAL
Small Practicum Group S 23.7 635 136.8
F = 44.3 + (3.89)PCAL
First-year students 26.3 649 149.1
F = 46.2 + (3.93)PCAL
First-year (control group C) 26.0 649 147.4
F = 46 + (3.9)PCAL
First-year (WeBWorK group W) 26.4 648 150.1
F = 49 + (3.7)PCAL
Non-repeaters 13.9 571 113.4
F = 80.8 + (2.20)PCAL
Non-repeaters (control group C) 13.9 574 114.3
F = 81.9 + (2.16)PCAL
Non-repeaters (WeBWorK group W) 13.9 569 114.5
F = 80.3 + (2.31)PCAL
Repeaters 18.3 584 104.2
F = 61.6 + (2.27)PCAL
Repeaters (control group C) 19.0 573 107.4
F = 39.8 + (3.38)PCAL
Repeaters (WeBWorK group W) 17.6 585 102.1
F = 63.2 + (2.27)PCAL
Table 6: Precalculus Placement versus Final Exam
WeBWorK and placement scores as predictors
To determine the most significant predictors of final exam score,
we did an analysis of variance using the 522 students in WeBWorK sections
for which we had complete data. This analysis indicated that the two most
significant predictors of final exam score were:
(a) the WeBWorK TOTAL, and (b) the precalculus placement score PCAL.
For the 709 students for which we had this data, the best fit was:
Predicting first-year student performance
For the first-year students who were in WeBWorK sections,
TOTAL and PCAL were also the most significant predictors.
Among the 524 first-year students for which we had this data, these
variables accounted for 43% of the variance in the data (as measured by
the R-squared statistic). The least squares fit was:
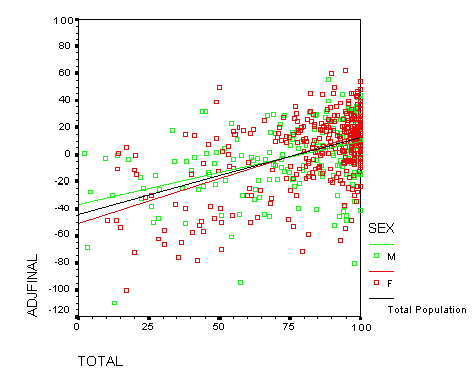
Figure 7: Adjusted Final Exams versus WeBWorK TOTAL
(First-year students, by gender)
The data cluster in the upper right is a very noticeable feature.
It reflects the fact that most first-year students did most of the
WeBWorK problems. It also reflects the fact that the effect of
WeBWorK is quadratic.
To illustrate this quadratic nature, and also to spread out the data
somewhat, figure 7a plots the adjusted final versus the T^2, the
square of the WeBWorK total (expressed as a fraction). As in figure
6, we have grouped the data by gender.
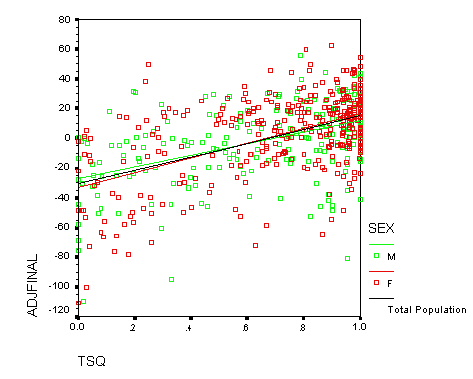
Figure 7a Adjusted Final Exams versus squared WeBWorK scores
(first-year students, by gender)
Predicting upper-class Non-Repeater's performance
For the upper-class non-repeating students who were in WeBWorK sections,
PCAL and TOTAL were also the most significant predictors.
Among the 108 non-repeating students for which we had this data, these
variables accounted for 39% of the variance in the data (as measured by
the R-squared statistic). The least squares fit was:
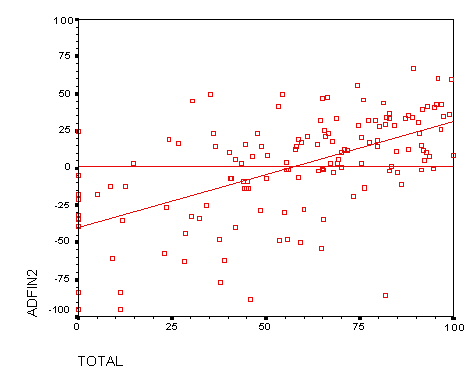
Figure 8b: Adjusted Final Exams versus WeBWorK TOTAL
(upper-class non-repeating students)
Visually, there is a clear relation between the WeBWorK score and the
adjusted final exam score, especially for students who do at least
half of the WeBWorK assignments. In fact, this scatterplot is not much
different than Figure 5b.
Predicting performance of Repeating students
There were only 51 students in WeBWorK sections that were repeating
the course. Of these, we had complete data (High School rank, etc.)
for only 30 of these students.
An analysis of variance showed that the most significant predictor of
final exam scores was the verbal SAT score (accounting for only
22% of the variance), followed by the WeBWorK TOTAL and the
Precalculus Placement score, PCAL. We believe that the appearance of
the new variable (verbal SAT) is due primarily to the small sample
size, since it is difficult to see the mechanism by which the verbal
skill level would play a significant role on the final exam.
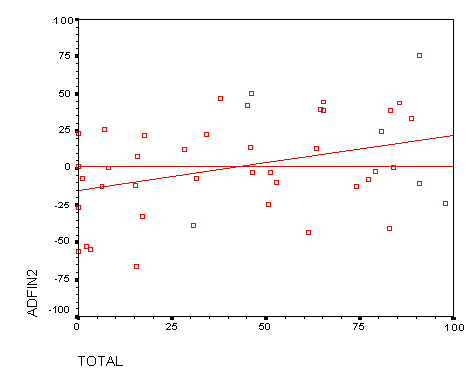
Figure 8c: Adjusted Final Exams versus WeBWorK scores
(students repeating calculus)
Factor Analysis
Since there was some correlation between the various predictors of
final exam score, we also did a factor analysis to determine what the
most important predictive factors were. As in our earlier study, we
restricted to first-year students, with the additional restriction that
they did at least one WeBWorK problem, and took the final exam. We found
two significant factors.
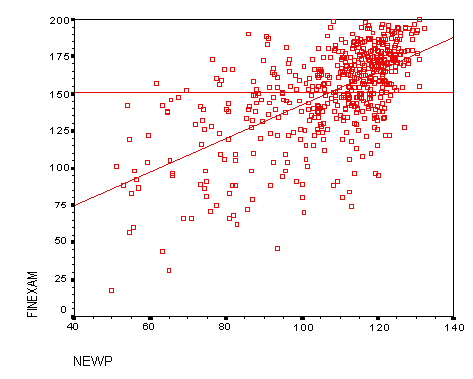
Figure 9: Final Exams versus New Predictor
(first-year students)
APPENDIX: Statistical Justification of Regressions
In the study, we did several linear regressions of the final exam
scores FINAL using placement scores PCAL (See Table 6). In
this appendix we explain why these regressions are reasonable.
1. The residuals are normal.
2. Homoscedasticity holds.
This means that the variance is constant across outcome levels.
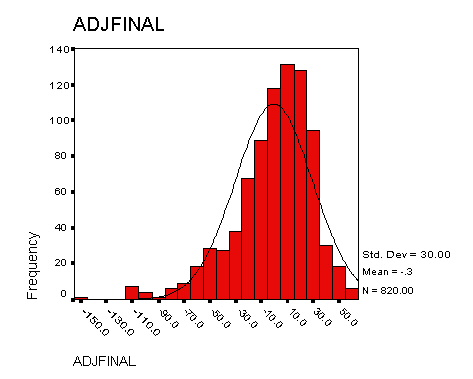
Chart A1: Frequency distribution for ADJFINAL vs. a normal distribution
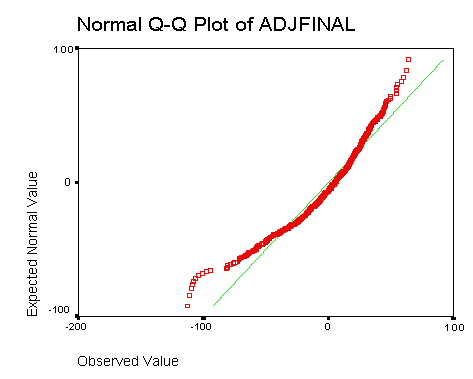
Figure A2: QQ Plot comparing ADJFINAL to a normal distribution
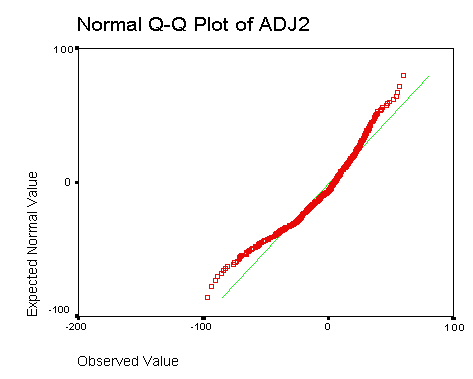
Figure A3: QQ Plot comparing residuals to a normal distribution
ADJ2 is the residual for the regression of FINAL against TOTAL
3. The predictor variables are linearly independent.
As we mentioned in the study, the correlation between PCAL and TOTAL
was low: .23 for first-year students, .14 for non-repeaters and
.05 for repeaters. So this assumption is not badly violated either.
References
[W] C. Weibel,
Effectiveness of Rutgers' Calculus Formats - Part I, 1999.
weibel @
math.rutgers.edu