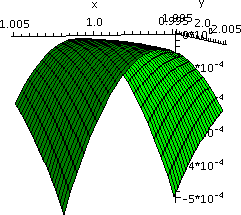
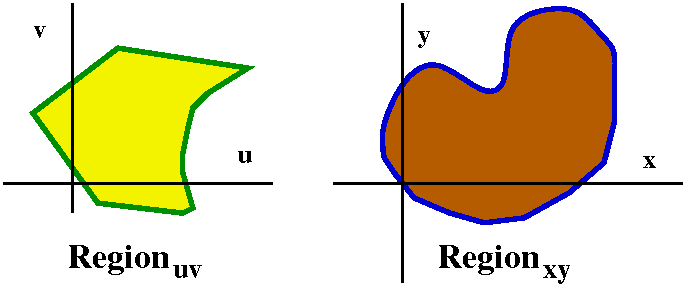
We could think that the region inside the uv circle is broken up into
many small pieces of area dAuv and then these are magically
(?) transported to the xy plane, and they form the interior of an
ellipse with horizontal semimajor axis of length 2 and vertical
semiminor axis of length 1. What is the area inside the ellipse? Here
is one way to compute that area:
Area of xy ellipse=∫∫ellipse in
xy1 dAxy=∫∫circle in uv1 (2dAuv)=2∫∫circle in uv1 dAuv=2(Π12).
I used scaling=constrained because if that's removed, some of the
effect of the shear seems to be undone. Try it, and see what you get
(a tilted ellipse with y=x as one axis, actually, and then you should
explain this!).
Since 1dAuv=dAxy, the total area is not
changed at all. Therefore the area inside
x2–10xy+26y2=1 is exactly equal to
Π12. I think if I worked diligently with dxdy
integrals and used trig substitutions as they are taught in 152 I
might, after a while, be able to get this result. But a whole
heck of a lot of work would need to be done.
So what's going on ...
This result is not used as in the past examples. That is, people don't
decide, "Hey, let's look at u and v and see ..." Rather, what happens
is that sometimes folks realize they need to evaluate some (horrible)
double/triple/whatever integral. They look at it, and see, somehow,
some sort of links between the integrand and the region. They see,
somehow, that everything could be described in terms of other
variables. Then they reach in and use the result that follows. Note
that no one I know uses this result "casually" -- they use it only if
they really need it.
 The theorem
Suppose x and y are written as functions of u and v. Then JAC, the area distortion factor, is the absolute
value of a certain determinant:
    | ∂x/∂u ∂x/∂v |
det |             |
    | ∂y/∂u ∂y/∂v |
If Ruv is a region in the uv plane and Rxy is
the corresponding region in the xy plane, if FUNCxy is a function written in terms
of x and y, and if FUNCuv is the function rewritten
in terms of u and v, then
∫∫RuvFUNCuv (JAC) dAuv=∫∫RxyFUNCxydAxy
Names
JAC is called the Jacobian. The
result above, discussed in section 15.4, and particularly stated on
pages 928 and 929 of the text, is called the Change of Variables
Formula.
Maybe I should give a slight indication where the result comes
from. So here is some heuristic reasoning: I want to describe how a
tiny Δu by Δv rectangle in the u,v-plane gets distorted in
the xy-plane. JAC is this distortion
factor. I would like to compare the areas. Here x=x(u,v) and y=y(u,v)
are some functions, and I don't know much about them.
I was only able to suggest the following information during class.
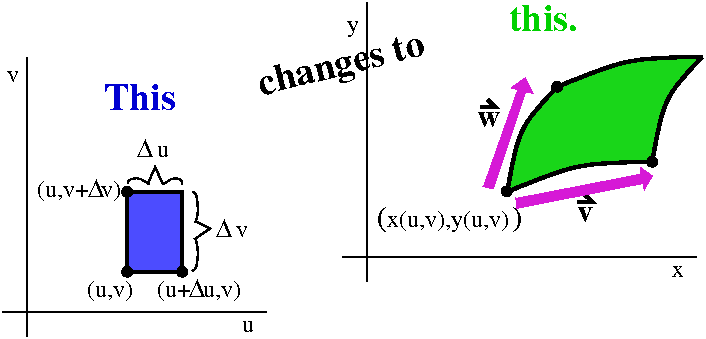 Suppose one corner of the small uv box is at the point (u,v). Then the
horizontal edge of the box goes from (u,v) to (u+Δu,v). What
happens in the xy-plane? If Δu is very small, we can hope that
the image of the horizontal line segment is some curve, and maybe it
is also straight. This almost (?) line segment starts at
(x(u,v),y(u,v)) and goes to ... well, what happens to x(u,v) and
y(u,v) if we "kick" u to u+Δu? The linear approximation idea is
that this becomes (except for higher order errors which are very small
if Δu is small)
x(u+Δu,v)≈x(u,v)+(∂x/∂u)Δu and
y(u+Δu,v)≈y(u,v)+(∂y/∂u)Δu. So the "edge"
in the xy-plane is nearly a vector with tail at (x(u,v),y(u,v) and
head at
(x(u,v)+(∂x/∂u)Δu,y(u,v)+(∂y/∂u)Δu).
This is the vector (in the diagram shown, this is v)
<(∂x/∂u)Δu,(∂y/∂u)Δu> which is
Δu (a scalar) multiplying the vector
<(∂x/∂u),(∂y/∂u)>. The vector for the other
edge (which is in the diagram shown, this is w) is Δv multiplying
<(∂x/∂v),(∂y/∂v)>. To get the area of the
parellelogram of the rectangle determined by these vectors, we find
the magnitude of their cross product.
Suppose one corner of the small uv box is at the point (u,v). Then the
horizontal edge of the box goes from (u,v) to (u+Δu,v). What
happens in the xy-plane? If Δu is very small, we can hope that
the image of the horizontal line segment is some curve, and maybe it
is also straight. This almost (?) line segment starts at
(x(u,v),y(u,v)) and goes to ... well, what happens to x(u,v) and
y(u,v) if we "kick" u to u+Δu? The linear approximation idea is
that this becomes (except for higher order errors which are very small
if Δu is small)
x(u+Δu,v)≈x(u,v)+(∂x/∂u)Δu and
y(u+Δu,v)≈y(u,v)+(∂y/∂u)Δu. So the "edge"
in the xy-plane is nearly a vector with tail at (x(u,v),y(u,v) and
head at
(x(u,v)+(∂x/∂u)Δu,y(u,v)+(∂y/∂u)Δu).
This is the vector (in the diagram shown, this is v)
<(∂x/∂u)Δu,(∂y/∂u)Δu> which is
Δu (a scalar) multiplying the vector
<(∂x/∂u),(∂y/∂u)>. The vector for the other
edge (which is in the diagram shown, this is w) is Δv multiplying
<(∂x/∂v),(∂y/∂v)>. To get the area of the
parellelogram of the rectangle determined by these vectors, we find
the magnitude of their cross product.
Let's compute the cross product. It will be (Δu)(Δv)
multiplied by: | i j k |
det| (∂x/∂u) (∂y/∂u) 0 | = [(∂x/∂u)(∂y/∂v)-(∂y/∂u)(∂/∂v)]k
| (∂x/∂v) (∂y/∂v) 0 |
To get the magnitude of this vector which only has a k component, we
take the absolute value of the coefficient, which is exactly what I
called JAC before. This sort of explains a
piece of the formula above. I hope it helps you "swallow" the change
of variables formula above.
|
So ...
This theorem is difficult to work with but the results can wonderful
when you can use it. Here are two computations I tried to show in
class.
This example is artificial but useful as a start
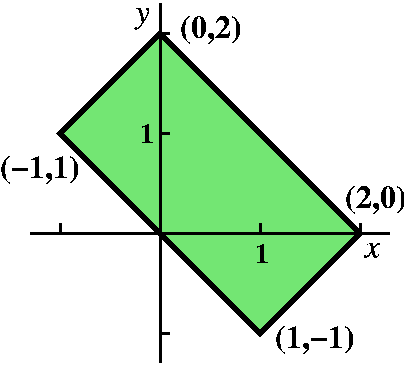 Compute
∫∫R(x–y)40(x+y)50dA where R is
the rectangular region with corners (1,–1), (2,0), (0,2), and (–1,1).
This is an irritating integral. But there is some not well concealed
symmetry. The boundaries of rectangle can be written as x+y=2,
x+y=0, x–y=–2, and x–y=2.
Compute
∫∫R(x–y)40(x+y)50dA where R is
the rectangular region with corners (1,–1), (2,0), (0,2), and (–1,1).
This is an irritating integral. But there is some not well concealed
symmetry. The boundaries of rectangle can be written as x+y=2,
x+y=0, x–y=–2, and x–y=2.
It almost seems as if the integrand and the region are begging
us to rewrite everything in terms of u and v where u=x–y and
v=x+y. Then the region of integration can be described
–2≤u≤2 and 0≤v≤2. The integrand becomes
u40v50. Notice that if we add the equations
u=x–y and v=x+y and divide by 2 we get x=(1/2)(u+v). If we
subtract the first equation from the second and divide by 2 we get
y=(1/2)(v–u).
What's JAC?
Since x=(1/2)(u+v) and y=(1/2)(v–u) we compute
    | ∂x/∂u ∂x/∂v |       | 1/2  1/2 |
det |             | = det |          | = -1/4 -1/4 = -1/2
    | ∂y/∂u ∂y/∂v |       | 1/2 -1/2 |
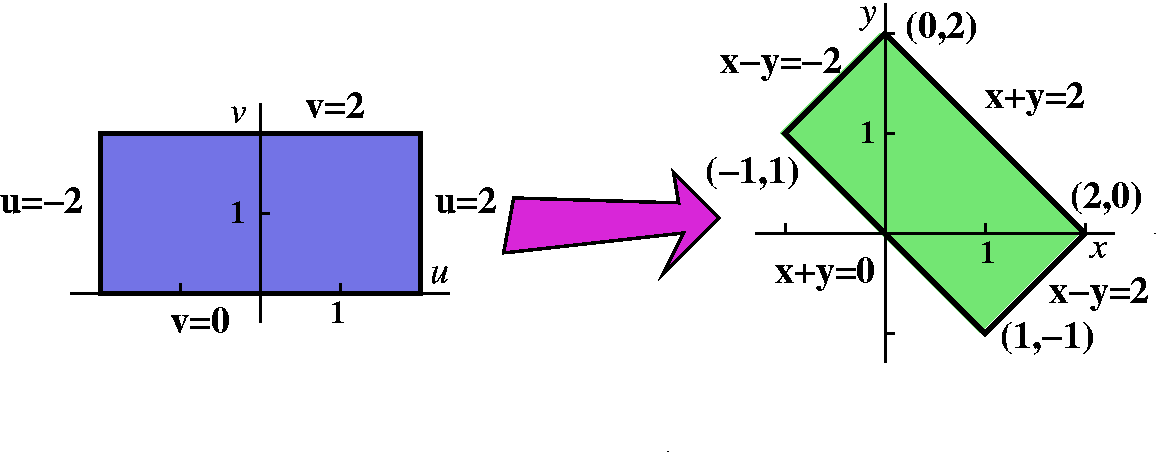 JAC is the absolute value, 1/2.
We have in effect parameterized the xy plane with
(1/2)(u+v)=x and (1/2)(v–u)=y. So everything in x and y could be
written in terms of u and v. The "General Change of Variables"
result becomes what follows in this case:
∫∫Rxy(x–y)40(x+y)50dAxy=∫v=0v=1∫u=–2u=2u40v50(1/2)du dv.
This can be evaluated exactly easily because it is just a mess of
powers of u and v. The answer is:
(1/2)2·(241/41)(251/51).
Crazy people all over ...
Or you could just try it in Maple as it
is. But we will need to break up the integral into three pieces (in
either dxdy or dydx). Also, I want to learn how much time and space
the computation takes, so I will use showtime.
The instruction showtime(true); has this
effect (from the Help page):
Any Maple statement entered is evaluated normally, its result returned
followed by a line numbered O1, O2, .. with the time taken and the
amount of memory used being displayed.
Here we go.> showtime(true);
O1 := func:=(x-y)^40*(x+y)^50;
40 50
(x - y) (x + y)
time = 0.00, bytes = 7382
O2 := A:=int(int(func,x=-y..2+y),y=-1..0);
618970019642690137449562112
---------------------------
1173
time = 0.08, bytes = 1394659
O3 := B:=int(int(func,x=-y..2-y),y=0..1);
41125671617232447642991204624847361028540479941115904
-----------------------------------------------------
62654905899056975234831847747
time = 0.08, bytes = 1275540
O4 := C:=int(int(func,x=-2+y..2-y),y=1..2);
74187486054615395748140995710384329611242731900764160
-----------------------------------------------------
62654905899056975234831847747
time = 0.13, bytes = 1880463
O5 := A+B+C;
4951760157141521099596496896
----------------------------
2091
time = 0.00, bytes = 3963
O6 := %-(2^(41)*2^(51))/(41*51);
0
time = 0.00, bytes = 3988
So our result is the same as the rather painful direct computation,
which took a total of .29 seconds. That is not terrible (but not a
computation that one would want to do in "real time"
applications). More important to me is that this "direct" computation
gave no insight. "The purpose of
computing is insight, not numbers."
|
What's going on?
If there is something common among the algebraic and geometric
specifications of a double (or a triple!) integral, then we can
sometimes take advantage. That's what's going on.
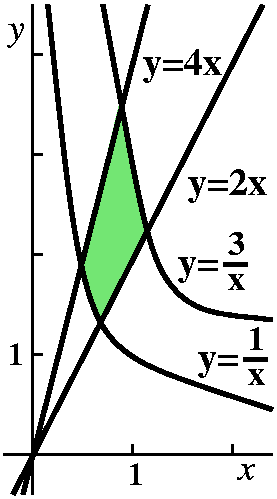
Another example, but this one more realistic
The following example could arise in thermodynamics or physical
chemistry. Suppose R is the region in the first quadrant bounded by
y=2x, y=4x, y=1/x, and y=3/x. Let's compute ∫∫Rx4y dA.
Here a neat "change of variables" is a bit hidden, but maybe you can
see that the boundary curves of the region are y/x=2 and y/x=4 and
xy=1 and xy=3. Then you might (!) think to define u=y/x and v=xy. If
you do, then uv=(y/x)(xy)=y2 so that
y=u1/2v1/2. Then v=xy becomes
v=x(u1/2v1/2) so that
x=u–1/2v1/2. Here's where I had to stop in
class because I ran out of time. A complete solution follows.
|
With the equations
x=u–1/2v1/2 and y=u1/2v1/2
the original integrand
x4y becomes u–3/2v5/2. The Jacobian
computation is:
    | ∂x/∂u ∂y/∂u |       | -(1/2)u-3/2v1/2 (1/2)u-1/2v1/2 |
det |             | = det |                              |
    | ∂x/∂v ∂y/∂v |       | (1/2)u-1/2v-1/2 (1/2)u1/2v-1/2 |
and this is
–(1/4)u–1–(1/4)u–1. We
want the absolute value so we have (1/2)(1/u). In this case, which is
considerably more complicated than the others above, the amount of
stretching depends on the value of u. In the other cases we looked at
previously, the stretching was the same at all points. In the real
world, non-uniform stretching is more likely. (Take either a piece of
taffy or a steel bar and pull at the ends. I bet that the part near
the center stretches more than the parts near the ends.) The double
integral which results is
∫13∫24u–3/2v5/2(1/2)(1/u)du dv.
The region of integration has become a rectangle, the integrand is not
horrible, and the Jacobian factor is also not too bad. I won't
compute this, but I hope that you see it is easy enough.
Possible QotD
I was going to ask students about the following transformation and its
consequences.
Suppose we change (u,v) to (x,y) using the equations x=u+v2
and y=v. Then here is how some points are changed:
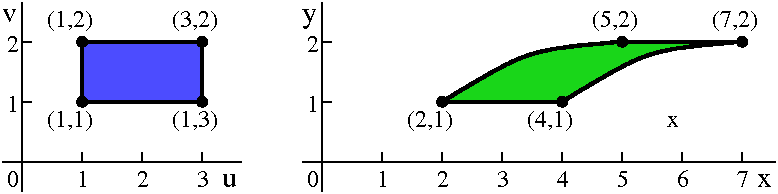
(u,v) coords  (x,y) coords
  (1,1)         (2,1)
  (1,2)         (5,2)
  (3,1)         (4,1)
  (3,2)         (7,2)
The line segment from (1,1) to (1,2) has u fixed as 1, and v varying
between 1 and 2. Therefore y varies from 1 to 2, and
x=1+v2=1+y2. This is part of a sideways
parabola.
The Jacobian of this transformation is | xu yu | | 1 0 |
det | | = det | | = 1
| xv yv | | 2v 1 |
so area doesn't change with this transformation -- to me
this is a bit surprising again. People sometimes call this
sort of mapping a non-linear shear.
Polar and spherical ...
The factors involved in integration in polar/cylindrical
(r drd&theta) and spherical
(ρ2sin(φ) dρdφdθ) all come
from Jacobian calculations. The spherical factor is the absolute value
of a determinant of a 3-by-3 matrix. The computation is not fun. I've
done it several times and have managed to make mistakes each time.
Proof? Who needs a proof?
Verification of the change of variables formula (a proof) for
double and on up integrals is very difficult. What's needed is
knowledge of linear algebra and lots of comfort with limit processes,
since the two sides of the formula are quite complicated Riemann
sums. Working through the proof in detail takes about two weeks in an
upper-level math course. Please believe this result, and try a few
examples on your own.
|
A juggling act ...
I discussed the difficulties of using this method with a number of
students after each lecture. There are three aspects: how the
region can be described, how the integrand can be
described, and how the Jacobian can be computed. Somehow
successful use is done by noticing nice coincidences. This can
take a lot of experimentation. In examples for this class, an
introductory course, I'll try to be sure that things, the problems
I'll ask you to do, will be relatively straightforward.
Thursday, November 4, sections
12-14, and Friday, November 5, sections 15-17, lecture #19
Note to students
I unfortunately was not able to be in class for this lecture due to a
professional obligation. I asked Mr. Bouch and Mr. Nanda to
substitute, and I am sure they did a fine job. I asked them to cover
the following material.
Today we will discuss systematically methods which will help with
integrals over regions with axial or central symmetry. Both coordinate
systems are ways of extending polar coordinates to R3.
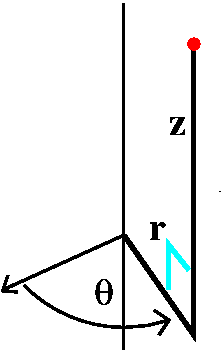
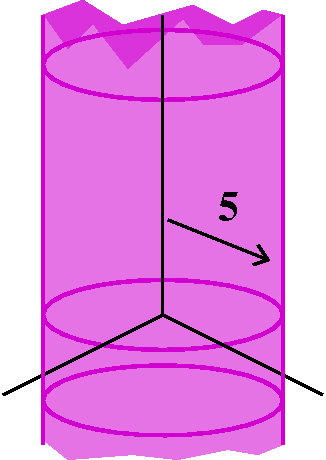
Cylindrical coordinates
This is a coordinate system that augments the r and θ of polar
coordinates with z. Any problem with an axis of symmetry may be easier
to understand in cylindrical coordinates. In words, the position of a
point in the cylindrical coordinate system is described by its height,
z, from the base coordinate plane. The foot of a perpendicular from
the point to the plane then has a description in terms of an angle,
θ, from an initial ray (usually the positive x-axis) and a
distance, r, from the origin.
|  |
Some basic axially symmetric surfaces
|
r=5 is the collection of points in R3 whose distance
to the "axis" is 5. The axis is the z-axis, so this will be a right
circular cylinder of radius 5 having the z-axis as axis of symmetry.
|
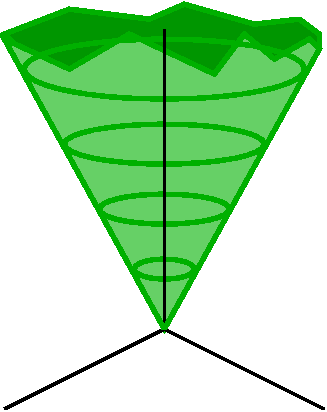
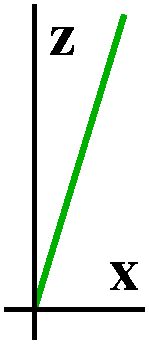 z=7r gives a right circular cone whose axis of symmetry is the
z-axis. How can you "see" this? Well, if we restrict ourselves to the
slice of this surface through the xz-plane (with y=0) we get a picture
sort of like what is shown. Why? Because if
y=0, r=sqrt(x2+y2)=x (at least for x>0), so
the result is the line shown.
z=7r gives a right circular cone whose axis of symmetry is the
z-axis. How can you "see" this? Well, if we restrict ourselves to the
slice of this surface through the xz-plane (with y=0) we get a picture
sort of like what is shown. Why? Because if
y=0, r=sqrt(x2+y2)=x (at least for x>0), so
the result is the line shown.
In general, since θ is not restricted, we get all the points
shown as we revolve the "profile" curve around the z-axis. And this is
a cone with vertex at the origin.
|
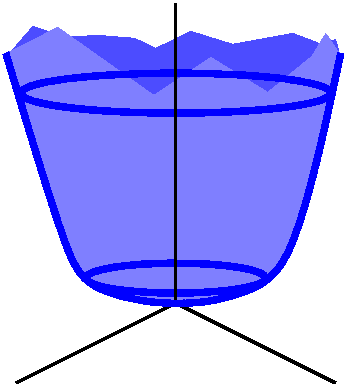
z=3r2 is a paraboloid, because
r2=x2+y2 and you should see, I hope,
that the result is what happens when the profile curve, a parabola
through the origin, is revolved around the z-axis.
|
 |
 |
 |
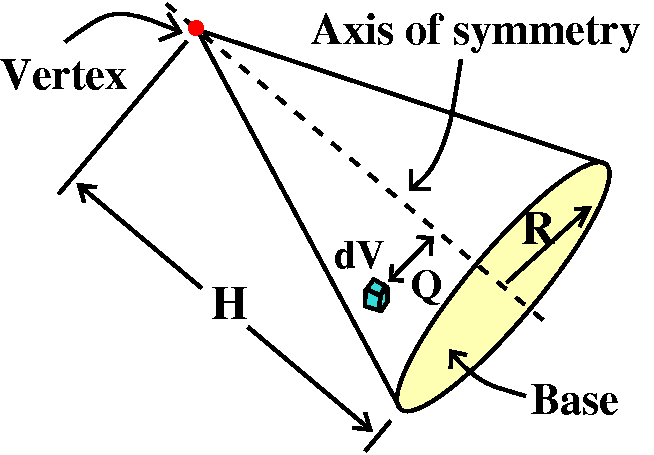
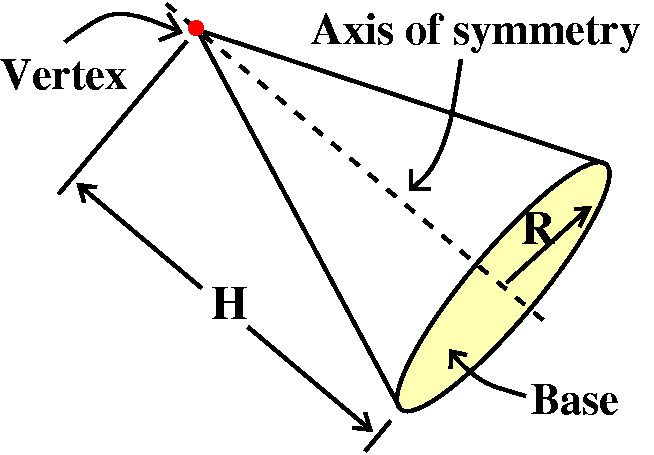 (Almost a real problem!) Moment of inertia of a cone
Suppose a right circular cone with base radius R and height H is
filled with a homogeneous substance with constant density, C. What is
the moment of inertia of the cone about its axis of symmetry?
Let me be more clear about some vocabulary.
Right circular cone
Take a circle (to be called the base). Put a line perpendicular to the
plane of the circle through the circle's center. Pick a point on
this line which is not on the plane of the circle. Connect that point
(called the vertex) with the edge of the circle. The solid interior to
the collected line segments and the circle is called a right circular
cone. The "right" refers to the right angle that the axis of symmetry
makes with the base.
Moment of inertia
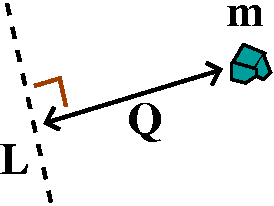
Take a little piece of mass, m, external to a line, L. The moment of
inertia of m about L is defined to be Q2m where Q is the
distance from m to L.
There are many discussions of the moment of inertia on the web. One link
declares that it is the "inertia with respect to rotational motion"
and another
reads "... the rotational analog of mass for linear motion. It appears
in the relationships for the dynamics of rotational motion. The moment
of inertia must be specified with respect to a chosen axis of
rotation."
I think of a small merry-go-round in a playground, and trying to push
the seats around (with many noisy, small children on them). The moment
of inertia measures the resistance of the merry-go-round to being
pushed.
 Beginning the analysis
Take a little piece of volume, dV, inside the cone. (Note: this is a
piece of volume inside the cone. We are not just considering
the surface of the cone -- the cone is filled.) The mass of this
volume is C dV. Suppose Q is the distance of the piece from the
axis of symmetry. Then the moment of inertia of this chunk of mass
about the axis of symmetry is Q2C dV. To get the
moment of inertia of the whole cone we need to add up the pieces of
the moment of inertia. So we need
∫∫∫The whole coneQ2C dV.
A major decision in this and many other geometric/physical problems is
where/how to put a coordinate system on the objects involved. Here
almost surely people would agree that the axis of symmetry should be
the z-axis. Sane human beings can disagree about where the origin
should be. Some would put it at the vertex of the cone, with the base
"up", and some would put the origin at the center of the base of the
cone, with the vertex "up". I'll do the first alternative because I
think some of the algebra will be simpler. As I mentioned in class, I
drew the cone in this awkward way because I wanted people to think
about how they would prefer to see it.
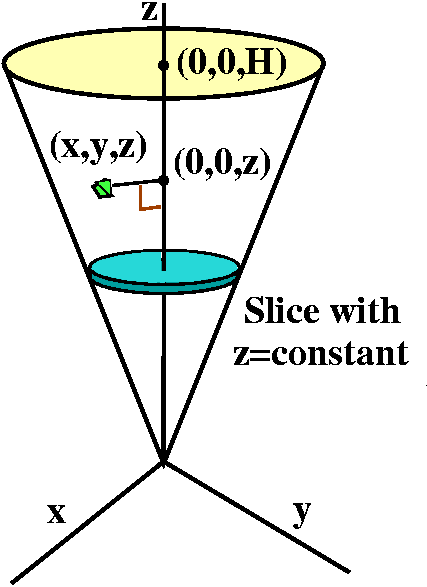 Coordinates?
Now the cone is sitting correctly (?) in the picture. The chunk of
volume is at (x,y,z), and the closest point on the axis of symmetry is
(x,y,0). The distance between (x,y,z) and the axis must therefore be
sqrt(x2+y2). We should convert the triple
integral into an iterated integral. What should be the order?
Actually, it is possible to do this in any order, but the
simplest way has dz on the outside. Then the z limits are clear: from
0 to H, and the slices with z=CONSTANT are also simple shapes:
circles. The triple integral
∫∫∫The whole coneQ2C dV
becomes the triply iterated integral
∫z=0z=H(∫∫ (sqrt(x2+y2))2C dAxy)dz. I wrote dAxy to remind myself that the
double integral is in the xy-plane.
(sqrt(x2+y2))2C dAxy)dz. I wrote dAxy to remind myself that the
double integral is in the xy-plane.
The inside double integral is:
∫∫ (x2+y2)C dAxy.
Recognition: polar
Things are in red so that a bell will ring in your head and you will
think, polar!!!. Certainly
x2+y2=r2 and
dAxy=r dr dθ. The limits on θ for a
whole circle are 0 and 2π. The limits on r are 0 (the center of the
circle) out to the radius of the circle, which I will cleverly call
RAD. The double integral is then
∫θ=0θ=2π∫r=0r=RAD(r2)C r dr dθ.
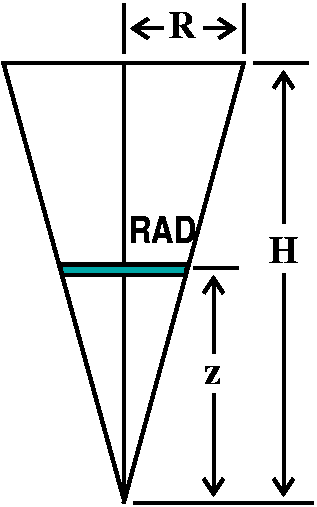
RADius
Look at the cone sideways and see some expected right triangles, so
RAD/z=R/H and RAD=(R/H)z. The double
integral becomes
∫θ=0θ=2π∫r=0r=(R/H)zC r3 dr dθ.
We compute the moment of inertia. Here it is:
∫r=0r=(R/H)zC r3 dr=(C/4)r4]r=0r=(R/H)z=(C/4)R4z4/H4.
∫θ=0θ=2π(C/4)R4z4/H4dθ=[(π C)/2]R4z4/H4.
(Easy: no θ in the integrand so
just multiply by 2π.)
∫z=0z=H[(π C)/2]R4z4/H4dz=[(π C)/10]R4z5/H4]z=0z=H=[(π C)/10]R4H.
Is this correct?
The units of moment of inertia should be
mass·(length)2. Since C is a density, C's units are
mass/(length)3. And R4H is length5 so
the units are correct. Sigh. What about the crazy constants (π and
10)? An engineering student who took Math 251 in a previous
semester sent me e-mail about this, and here is part of his message:
Upon consultation with my statics text, I present to you: ...
I_x = 3/10 * m * a^2 where a is the radius of the base of the cone.
Let's see: the statics text refers to the mass, m, of the cone. That
is the density, C, multiplied by the volume. The volume of this right
circular cone is (π/3)R2H. The student's "a" is our R. So the
formula
3/10 * m * a^2 becomes (3/10)C[(π/3)R2H]R2
which is indeed [(π C)/10]R4H. We have confirmation
by high authority: "my statics text".
|
The location of Hill Center
I enlightened students with
these facts about Hill Center, Rutgers building #3752:
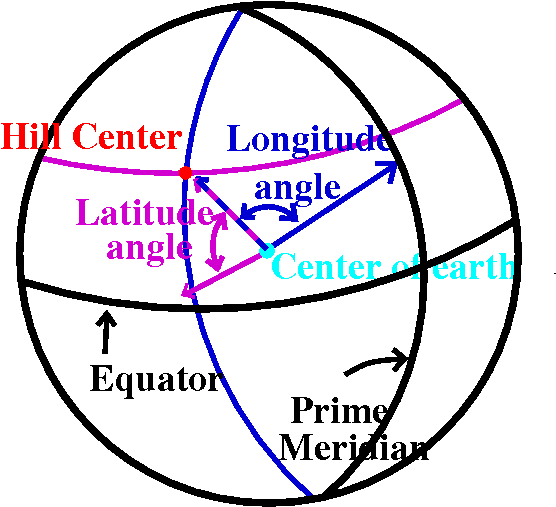 HC's latitude is 40.523193oN
and HC's longitude is 74.464012oW.
HC's latitude is 40.523193oN
and HC's longitude is 74.464012oW.
Or, in more antique fashion
(degrees/minutes/seconds), the latitude is
40o31´23´´ and the longitude is
74o27´50´´. Or maybe .707263 radians and
1.299642 radians. Sigh.
Do not be as confused as I am. This is
not about stalactites (the down-dropping things) and stalagmites (the
up-growing things).
We discussed what latitude and longitude are. The prime meridian is a
great circle (a circle whose center is the center of the earth) and it
goes through Greenwich, England and the north/south poles. The
longitude is the angle between that great circle and the great circle
connecting HC and the north/south poles. The angle has vertex at the
center of the earth. W=west in the latitude, and it means the the
angle opens to the west of the prime meridian. Latitude is the angle
from the intersection of the great circle describing HC's longitude
with the plane of the equator, again with the vertex at the center of
the earth. N=north means that we look in the northern
hemisphere. Constant latitude means a "small" circle. Constant
longitude means a great circle (actually semicircle). HC is located at
the unique intersection on the surface of the earth of these two
curves.
I presume you know that the "23 and a half"
degree tilt of the axes (north/south pole line) from the ecliptic (the
plane of the earth's orbit about the sun) is responsible for seasonal
variation. Nature is terrific!
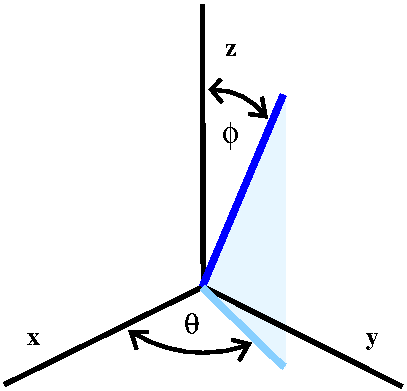
Spherical coordinates
Take a point in space. We describe its position with one length and
two angles. The length is the distance of the point to the origin: the
length of the radius vector. The first angle, φ, is the angle from
the positive z-axis to the radius vector. The second angle, θ, is
the angle from the positive x-axis to the projection of the radius
vector on the xy-plane. Spherical coordinates are very useful in
problems with central symmetry.
I deduced the following formulas:
x=ρ sin(φ)cos(θ)
y=ρ sin(φ)sin(θ)
z=ρ cos(φ)
It is useful to know that such formulas exist, but that I rarely use
them. One result that I have used frequently comes from the fact that
ρ represents the distance from (x,y,z) to the origin.
x2+y2+z2=ρ2.
Standard restrictions on spherical coordinates
Because the angles sort of fold over when Π's and 2Π's are
added, most people who use spherical coordinates put some restrictions
on how big/small θ and φ can be. If we only allow
ρ>0, θ to be between 0 and 2Π and φ to be between
0 and Π, then there will be unique spherical coordinates for every
point in R3. So I will generally work with these
restrictions.
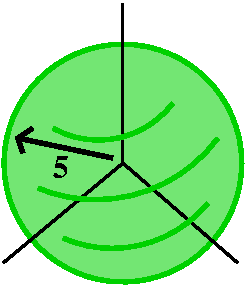
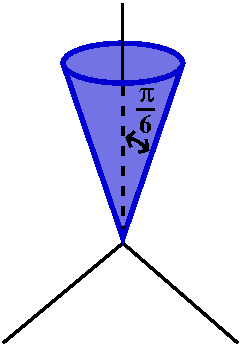
Some shapes in spherical coordinates
|
ρ=constant gives a sphere centered at the origin. So, for example,
ρ=5 is a sphere centered at the origin of radius 5.
|
φ=constant gives a right circular cone whose axis of symmetry is the
z-axis. For example, φ=Π/6 is a cone with vertex at the origin and
whose axis of symmetry is the positive z-axis. The angle between the
positive z-axis and any of the cone's "generators" (lines from the
vertex on the surface of the cone) iw Π/6 (yes, 30o). The
bottom half of the cone is not included because that is where φ is
between Π/2 and Π.
|
θ=constant gives a half-plane, with the z-axis being the edge of
the half-plane. For example, θ=Π/4 gives a half-plane which is
perpendicular to the half-line y=x (x>0) in the xy-plane. The other
half of the plane is where θ is 3Π/2, and so it is not included
in this object.
|
 |
 |
 |
Integral #1
A spherical region of radius R is filled with material whose density
is directly proportional to the distance from the origin. What is its
mass?
This is not very realistic. The center is light and
fluffy and the outer edge is heavy and tough (my kind of
cooking?). The density is supposed to interpolate linearly between
these extremes. Maybe the appropriate assignment would be to build an
object of this type.
The math setup
Take a small piece of volume, dV, in the sphere. The corresponding
piece of mass, dm, is related to dV by dm=(density)dV. We know that
the "density is directly proportional to the distance from the
origin." Place the origin of the coordinate system at the center of
the sphere. So there is some constant C>0 so
density=C ρ. And the total mass is the sum of the dm's. This
"sum" should be a triple integral:
Total mass=∫∫∫The whole ballC ρ dV.
In spherical coordinates, a description of a sphere of radius R
centered at the origin is easy: ρ goes from 0 to R, θ goes from
0 to 2Π, and φ goes from 0 to Π. We just use the agreed upon
ranges for the angles to sweep out a whole sphere. There is one sticky
point, however.
dV in spherical coordinates
We need to convert dV to spherical coordinates. In fact,
dV=ρ2sin(φ)dρdθdφ
I know this is true (both true and absurd!). First, there is a
discussion which is supposed to be convincing in the text (on pages
915 and 916). Second, I said it in class. Third, I actually can give
an understandable argument if there is enough time later in the
course. This strange multiplier is an example of what is called the Jacobian,
a factor used to convert volume in one coordinate system to another. I
may have time to discuss the computation later. In any case, when I
use spherical coordinates, I almost never bother thinking about this
weird mess, but I just write it. You can think of the Jacobian as the
algebraic equivalent of a "penalty" for using spherical
coordinates. As the possible user, you need to decide whether using
spherical coordinates is worth the trouble. Sometimes the description
of the region is so darn simple that the dV formula is clearly so bad
enough.
The computation
So we have
Total mass=∫φ=0φ=Π∫θ=0θ=2Π∫ρ=0ρ=R(C ρ)ρ2sin(φ)dρdθdφ.
The inner integral
∫ρ=0ρ=R(C ρ)ρ2sin(φ)dρ=∫ρ=0ρ=RCρ3sin(φ)dρ=Csin(φ)ρ4/4]ρ=0ρ=R=Csin(φ)R4/4.
The middle integral
∫θ=0θ=2ΠCsin(φ)R4/4 dθ=(2Π C)sin(φ)R4/4=[(Π C)/2]sin(φ)R4.
(Just multiply by 2Π, since there is no θ in the integrand.)
The outer integral
∫φ=0φ=Π[(Π C)/2]sin(φ)R4dφ=–[(Π C)/2]cos(φ)R4]φ=0φ=Π=(Π C)R4.
I don't know any way to check this answer. Build a model? Weigh it?
Is this silly?
Well, yes, it is silly. The problem is invented and certainly designed
exactly for spherical coordinates. But I would not use spherical
coordinates, which definitely have peculiarities (look at the pictures
above and look at the expression for dV) unless both the region and the integrand
can both be described in a nice fashion with spherical coordinates. I
won't use this coordinate system otherwise. (Could you imagine using
spherical coordinates to describe a cube?)
Integral #2
Consider the region in the first octant consisting of points whose
distance to the origin is at least 1. Imagine that this is filled with
material whose density is inversely proportional to the fifth power of
the distance to the origin. What is the mass of this object?
Translating
All of R3 is divided into eight parts by the coordinate
planes: x=0, y=0, and z=0. Each part is called an octant. While
the corresponding regions in the plane (the quadrants) have individual
designations, the
only octant that is named is the first: the octant where
x>0 and y>0 and z>0. In this first octant, I'm
excluding points whose distance to the origin is less than
1. What does the remaining region look like? Here are several possible
pictures of the region. In this picture (sort of the corner of a
rectangular box), a spherical "bite" has been taken out of the
corner. The bite is centered at the vertex (the origin) and has radius
1. Wow!
|  |
|
To the right is a more oblique view of the octant with the bite.
The nice thing about this region is that it can be described very briefly
in terms of spherical coordinates. Certainly, ρ will go from
1 (as close to the origin as the bite will let us get) out to ... out
to ... infinity (an improper integral!). What about θ and
φ? Here students should look closely at the definitions of θ and
φ. Each of them will go from 0 to Π/2. This is best confirmed by
taking "angles" with vertex at the origin and a side along the x-
(respectively, z-) axis and then opening the second side of the angle
to an aperture of Π/2 (I think "aperture" means the angle's opening).
By the way, as I remarked in class, this is actually a more realistic
example than the first integral. Things like this do occur in
electricity and magnetism. |
|
The computation
Again dm=(density)dV=[C/ρ5]dV because "density is
inversely proportional to the fifth power of the distance to the
origin." And we know the limits from the discussion above, so the
total mass is
∫φ=1φ=Π/2∫θ=0θ=Π/2∫ρ=1ρ=∞[C/ρ5]ρ2sin(φ)dρdθdφ.
The integrand is [C/ρ3]sin(φ) after cancelling some powers.
The inner integral
This is an improper integral, so I will be careful.
∫ρ=1ρ=BIGC/ρ3sin(φ)dρ=–C/(2ρ2)sin(φ)]ρ=1ρ=BIG=–C/(2(BIG)2)sin(φ)
+C/(2(1)2)sin(φ). As BIG→∞, the
term –C/(2(BIG)2)sin(φ)→0 so the improper
integral
∫ρ=1ρ=∞[C/ρ3]sin(φ)dρ converges and its value is
(C/2)sin(φ).
The middle integral
∫θ=0θ=Π/2(C/2)sin(φ)dθ=(C/2)sin(φ)(Π/2)=[(C Π)/4]sin(φ).
The outer integral
∫φ=0φ=Π/2[(C Π)/4]sin(φ)dφ=–[(C Π)/4]cos(φ)]φ=0φ=Π/2=[(C Π)/4]
Again, I will admit that I don't know any way to check this
answer. When such an integral comes from a real physical problem,
there is frequently some way to see if the final answer is reasonable.
Further defense of silly (the same defense)
I would only use this technique, I hope!, where both the region
and the integrand are suitable. So, although the problems may have
seemed silly, they are the sort of applications which might occur. We
will need integration in spherical coordinates a few times later in
the course.
QotD
Try to set up in spherical coordinates the triple integral of z over
the lower half of the sphere of radius 5 centered at the
origin. Everything should be written in terms of spherical
coordinates!
- What do we integrate?
Since z=ρ cos(φ) and
dV=ρ2sin(φ)dρdθdφ we should be
integrating
ρ3cos(φ)sin(φ)dρdθdφ.
- What about the limits?
For ρ we go from 0 to 5 (the origin to the
farthest away point). For θ we got
all around the z-axis, so from 0 to 2Π. For φ, which is to me
the trickiest, we go from a right angle (on the xy-plane) to a
straight angle (on the negative z-axis), so from Π/2 to Π.
So the result is
∫φ=Π/2φ=Π∫θ=0θ=2Π∫ρ=0ρ=5ρ3cos(φ)sin(φ)dρdθdφ.
This absurd integral actually can be computed, and I think its value
is –54Π/4.
A student's request
 The planes x=0 and y=0 and z=0 divide R3 into eight
chunks. Differently put, if you remove these planes from space, you'll have
eight pieces left. Each of the eight pieces is characterized by
requiring that the variables x, y, and z have specific (non-zero!)
signs. I was asked by a student the last time I taught 251 how the spherical
coordinates φ and θ relate to these sign restrictions. This
is not a silly question. The answer is a bit complicated with details,
but maybe looking at it will help you.
The planes x=0 and y=0 and z=0 divide R3 into eight
chunks. Differently put, if you remove these planes from space, you'll have
eight pieces left. Each of the eight pieces is characterized by
requiring that the variables x, y, and z have specific (non-zero!)
signs. I was asked by a student the last time I taught 251 how the spherical
coordinates φ and θ relate to these sign restrictions. This
is not a silly question. The answer is a bit complicated with details,
but maybe looking at it will help you.
Look to the right. There is a very bare diagram with the spherical
angles φ and θ sketched. Of course, φ is the angle
between the radius vector and the positive z-axis. People usually
request that φ be in the interval [0,Π]. If this angle is
acute, so 0<φ<Π/2, then the radius vector will be
above the xy-plane, no matter what the value of θ. This
means z>0 exactly coincides with 0<φ<Π/2. If we push
the radius vector below the xy plane, then z<0 and φ
will be larger than Π/2. So z<0 is the same as
Π/2<φ<Π.
 θ does not affect the sign of z at all. It interacts with the
signs of x and y. So we can just look "downwards" in R3
from high up on the positive z axis. Then we might understand what
we're seeing as something like usual polar coordinates (remember, the
z information is carried by φ so we don't need that here).
Certainly we can just read off the sign combinations of x and y by the
usual quadrant information of θ.
θ does not affect the sign of z at all. It interacts with the
signs of x and y. So we can just look "downwards" in R3
from high up on the positive z axis. Then we might understand what
we're seeing as something like usual polar coordinates (remember, the
z information is carried by φ so we don't need that here).
Certainly we can just read off the sign combinations of x and y by the
usual quadrant information of θ.
| Sign of x | Sign of y | Sign of z |
Interval of θ | Interval of φ |
|---|
| x>0 | y>0 | z>0 | 0<θ<Pi/2 | 0<φ<&pi/2 |
| x<0 | y>0 | Π/2<θ<Π |
| x<0 | y<0 | Π/2<θ<3Π/2 |
| x>0 | y<0 | 3Π/2<θ<2Π |
| x>0 | y>0 | z<0 | 0<θ<Pi/2 | Π/2<φ<Π |
| x<0 | y>0 | Π/2<θ<Π |
| x<0 | y<0 | Π/2<θ<3Π/2 |
| x>0 | y<0 | 3Π/2<θ<2Π |
I hope this is helpful to other people who are trying to understand
spherical coordinates.
|
Tuesday, November 2, sections
12-14 and sections 15-17, lecture #18
Exam Warning!!!
The second exam will be given two weeks from today. See here for review materail and otyher
information.
Today begins three lectures where I will attempt to describe other,
more sneaky methods to compute multiple integrals. These methods
generally are used when specific computations are given and the
regions or the integrand (the function to be integrated) share some
kinds of symmetries. All of today's examples will be relevant to
engineering education. I'll begin with the following problem. I want
to compute a double integral, something like
∫∫Rf(x,y) dA. I will describe an f and an R.
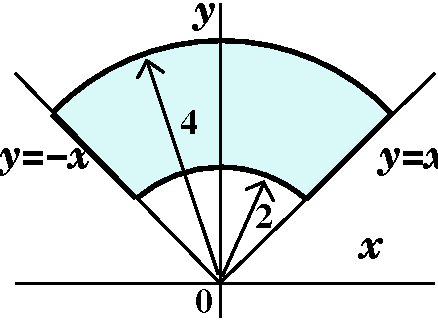 Let's let f(x,y)=x2+y2. That's certainly a
simple enough function, just a degree 2 polynomial in x and y.
Let's let f(x,y)=x2+y2. That's certainly a
simple enough function, just a degree 2 polynomial in x and y.
Suppose R is the region in the xy-plane defined by these restrictions:
it is in the upper half plane where y>0, and it has boundary
given by y=x and y=–x (two straight lines or, actually, since they are
inside a half plane, just two rays) and the circles
x2+y2=2 and x2+y2=4. I
think, or I hope, that this region is shown in the picture to the
right.
Comments
This would be a rather unpleasant double integral to compute as an
iterated dx dy or dy dx integral. I hope that you can see
why. The region R is not nicely convex in either the x or y direction,
and we'd need to break both of the iterated integrals into several
pieces.
I hope that there are enough accidents (?) and coincidences (??) so
that you are a bit suspicious. Of course, this example is totally
arranged. I hope that it makes you think of polar coordinates.
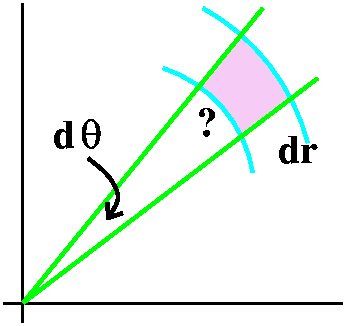 dA in polar coordinates
Here's a mostly emotional argument for how dA should be
described in polar coordinates. Later I will be able to give a more
precise derivation. Or you can look in the textbook (section 15.4) for
a more careful discussion.
Suppose I want to compute the area obtained by changing r to r+dr and
θ to θ+dθ. The picture displays this area, dA,
magnified a lot. As mentioned, dA is an area and has dimensions
length2. If dθ and dr are very small, the area dA is
approximately rectangular, and maybe the area is the product of the
length of its sides. Well, one side is dr but the other side is
not dθ. Angles don't have dimensions (they are ratios!)
and, anyway, if you move circles centered at the origin in and out,
you can see that the intercepted arcs change in length. These arcs are
very short close to the origin and are longer as the radius of the
circle gets bigger. In fact, the length of the intercepted arc is
directly proportional to r. This length is also directly proportional
to dθ: if the angle at the origin is doubled, the length of the
intercepted arc is also doubled. Well, "directly proportional" means
that there is some constant, uhhh ..., let's call it K, so that the
length is K r dθ. What is K? In the nicest world, K
would be 1 because then I would not have to worry about it any
more. Well, golly, that is
exactly why radian measure was invented: so this
darn constant would be 1 and
would not need attention.
Comment: so what is K and what about those words?
Why is K=1 in radians? Well, the circumference of a circle of radius r
is 2π r. Here the dθ is 2π. So apparently the K is
indeed 1. If you insisted on using degrees in all of calculus, then
the angle for a whole circle would be 360, and for
Kr dθ=K(360)r to be 2π r, you would need
K=2π/360, which is approximately the obnoxious number .01745. I
looked on the web, and the only other candidate for angle measurement
I found was the
grad, introduced in France as part of the metric system (my
calculator permits angle computations in grads). There are 400 grads
in a circle (I didn't know that) and therefore the constant K, if we
used grads in calculus, would be 2π/400 which is approximately
.01571, also obnoxious. Yes, things would be better if π were equal
to 3.
Euphemism: The expression of an unpleasant or embarrassing notion
by a more inoffensive substitute
The word "golly" is a euphemism for "God" and the word "darn" is a
euphemism for "damn".
|
Computing the integral
Let's return to computing
∫∫Rx2+y2dA, if R is the
region shown to the right (in the upper half plane, with the curves
arcs of circles centered at the origin).
How does one recognize that the integral is "polarish"? It is a
classroom example, but the integrand has central symmetry, and so does
the region. You may be helped if you recall the conversion
formulas
From r, θ to x, y      From x, y to r, θ
-------------------    -------------------
   x=r cos θ              r2=x2+y2
   y=r sin θ              tan θ=y/x
I've given the formulas the way I most often use them. In particular,
the formula for getting θ from x
and y needs to be "adjusted" (by adding π) if the point whose
coordinates are (x,y) is in the left half of the plane.
I recognize (primarily from the picture, but I can also use the
formulas) that R is described by π/4≤θ≤3π/4 and by
2≤r≤4. We can convert the integral into polar coordinates:
∫∫Rx2+y2dA=
∫π/43π/4∫24r2 r dr dθ=
∫π/43π/4∫24r3dr dθ=
∫π/43π/4(1/4)r4]r=2r=4dθ=(60)θ]π/43π/4=30π.
Certainly the computation is easy. It was arranged so that after
conversion to polar coordinates things would work out well. The
computation in rectangular coordinates, including finding the
boundaries of the integrals (there would have to be two of them) and
then computing the antiderivatives, would be very tedious. This is not
an entirely artificial example: it is the computation of the moment of
inertia about the origin of a thin homogeneous plate in the shape of
the region R.
The earth is flat
So here I will try to convince you by combining a valuable and
truthful computation with extremely dubious logic, that the earth is
flat. Please be reassured: the earth is probably not flat.
Newton's
Law of Universal Gravitation
Suppose I have two "point masses", m1 and m2,
which are a distance d apart. The magnitude of the force attracting
them together is directly proportional to the product of their masses
and inversely proportional to the square of the distance separating
them. The constant of proportionality is usually called G (alas, not
to recognize the lecturer!). Therefore the magnitude of the force is
G m1m2/d2.
A very good estimate for the actual value of G was found as a result
of a
remarkably precise experiment done by Henry Cavendish in 1797 and
1798. Here is part of a description of the experiment:
The apparatus constructed by Cavendish was a torsion balance made of a
six-foot (1.8 m) wooden rod suspended from a wire, with a 2-inch (51
mm) diameter 1.61-pound (0.73 kg) lead sphere attached to each
end. Two 12-inch (300 mm) 348-pound (158 kg) lead balls were located
near the smaller balls, about 9 inches (230 mm) away, and held in
place with a separate suspension system.[8] The experiment measured
the faint gravitational attraction between the small balls and the
larger ones.
The currently accepted value of G is about 6.67259 x
10–11 Nm2/kg2. Gravity is
actually much weaker than, say, magnetism. There is just a great deal
of mass around, and very few magnetic
monopoles.
|
 The plate: from description to integral
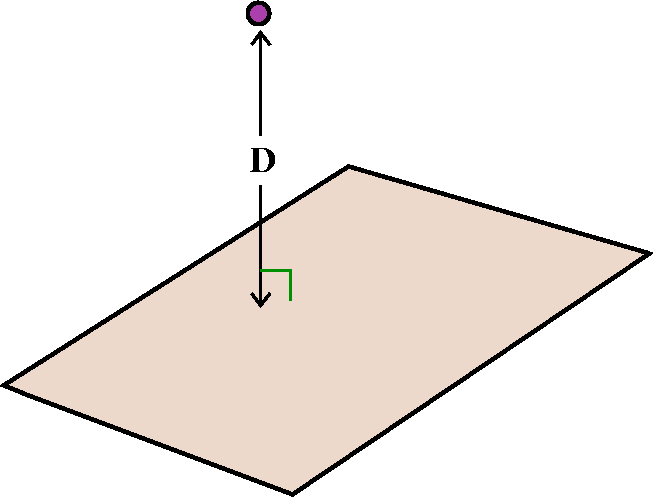
Let me assume that the "universe" consists of an infinite flat
homogeneous plate, and an external small object with a mass of m whose
distance to the plate is D. What is the gravitational attraction of
the object to the plate? A major part of such a problem is setting it
up. The correct location of the origin and the axes can make problems
much easier. In this case, I believe there are two reasonable
locations for the origin: the object, or the closest point on the
plane to the object. I'll use that closest point to be the origin. Of
course, the xy-plane will be the plate, and therefore the coordinates
of the object will be (0,0,D). The plate is homogeneous and thin. To
avoid having too many letters around, let me assume that the plate is
1 unit thick (otherwise I'll just have to carry around the thickness
in all of the computations, and I have a hard enough time with my own
thickness, both mental and physical). Since the plate is homogeneous
(the same at every point), it has a density, ρ. A small chunk of
the plate ("dA") located at the point (x,y) will have mass equal to
ρ dA (remember the thickness is 1, and so it is already in the
formula).
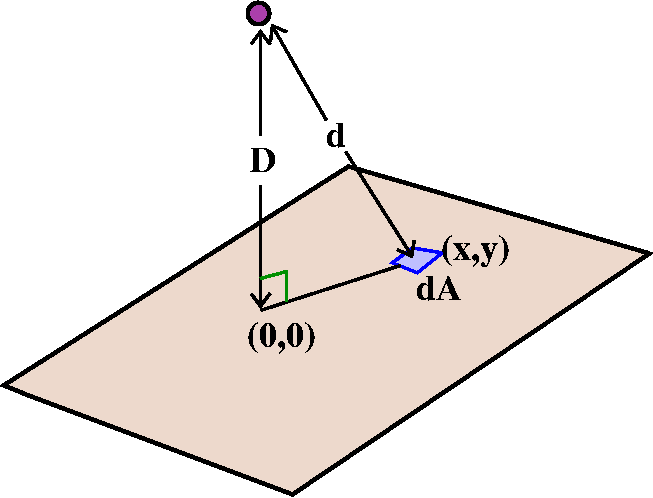
Now let us convert the ideas into more rigid "mathspeak". The
magnitude of the force from the external mass to the dA piece of the
plate is Gmρ dA/d2. The piece is located at (x,y), and
(x,y), (0,0), and the location of the external mass are at the
vertices of a right triangle. The hypotenuse of the right triangle is
d, and the leg of the triangle from the external mass to (0,0) is
D. The distance from (0,0) to (x,y) is
sqrt(x2+y2). Therefore
d2=D2+(sqrt(x2+y2))2. The square root and the square cancel. The
magnitude of the force is
Gmρ dA/(D2+x2+y2). Several
students noticed a surprising symmetry. Since we are dealing with the
whole plane, R2, the chunk of dA at (x,y) has an antipodal
chunk at (–x,–y), having the same mass and the same distance to the
external object. Therefore the "lateral" parts of the forces (parallel
to the plane) exactly cancel out. We only need to compute the vertical
component of the force.
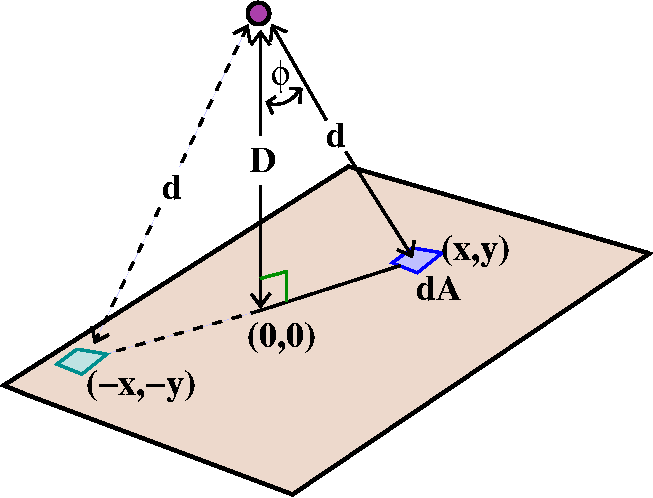 The vertical component of the force is the magnitude of the force
multiplied by the cosine of the angle, φ, between the vertical
line and the line connecting the external object to dA. But cos(φ)
is D/d, which is
D/sqrt(D2+x2+y2). The function to be
integrated is the vertical component of the gravitational attraction
between the external object and dA. This is
GmρD dA/(D2+x2+y2)3/2. Since
the plate is infinite, we want
∫∫All of R2Gmρ dA/(D2+x2+y2)3/2.
The vertical component of the force is the magnitude of the force
multiplied by the cosine of the angle, φ, between the vertical
line and the line connecting the external object to dA. But cos(φ)
is D/d, which is
D/sqrt(D2+x2+y2). The function to be
integrated is the vertical component of the gravitational attraction
between the external object and dA. This is
GmρD dA/(D2+x2+y2)3/2. Since
the plate is infinite, we want
∫∫All of R2Gmρ dA/(D2+x2+y2)3/2.
Computing the integral
Many of the letters are constants: G and m and ρ and D. We can
pull them out of the integral (but we will remember them for the final
result). We need to compute:
∫∫R2dA/(D2+x2+y2)3/2.
Since this comes immediately after a discussion of polar coordinates,
the student alert to pedagogical plans (how folks teach) will
immediately think of converting to polar coordinates. Indeed, even
those who are not so ... prescient might think: the region has
symmetry around (0,0) and the integrand has that same
x2+y2, so let's try polar coordinates!
Then dA=r dr dθ, and
r2=x2+y2, and all we need are the
limits on the integral. For the whole plane, r should go from 0 to
∞, and θ should go from 0 to 2π. The appearance of
∞ forces me to finally acknowledge that this is an improper
integral.
∫02π∫0∞r dr dθ/(D2+r2)3/2.
The inner (improper) integral
I will be careful, since I am supposed to be teaching a math course.
∫0∞r dr dθ/(D2+r2)3/2=limB→∞∫0Br dr dθ/(D2+r2)3/2
The r accompanying the dr is exactly what's needed to do the
substitution u=D2+r2 with du=2r dr. We sort out the constant by guessing (maybe).
∫0Br dr dθ/(D2+r2)3/2=–1/sqrt(D2+r2)]r=0r=B=
–1/sqrt(D2+B2)–{–1/sqrt(D2+02)}
As B→∞, the term
–1/sqrt(D2+B2)→0. The other term has minus
signs which cancel, and (let's say D>0) square/sqrt which cancel,
so the limit is 1/D.
The outer integral is easy:
∫02π(1/d)dθ=(1/D)θ]θ=0&theta=2π=2π/D.
But we need to multiply by the factors we pulled out. The whole answer
is:
GmρD(2π/D)=Gmρ2π.
And, therefore ...
There is no D in the answer!. The gravitational attraction of a
flat earth is constant! Now the lecturer discussed the fact that he
weighs the same standing on the floor and standing on a
chair. Therefore ... therefore ... the earth is flat. (And even more
supporting argument: wouldn't people who wanted to lose weight climb
Mt. Everest, because they would lose weight when ...).
Discussion of the claim
Ideally, we would like more measurements rather than fewer: with
many measurements we'd have a chance of coming up with more reliable
information.
Going abstract: the "limit"
Let me look at the average a bit more. The discussion that follows seems very clever to
me.
Suppose that I assume that the number of observations is
n3 where n is a large positive integer. Then I would have
something like this:
SUM of all of the temperature measurements
------------------------------------------
                    n3
I will multiply the top and bottom of this fraction by
(b–a)(d–c)(f–e), so we would have:
SUM of all of the temperature measurements   (b–a)(d–c)(f–e)
------------------------------------------ · ---------------
                    n3                       (b–a)(d–c)(f–e)
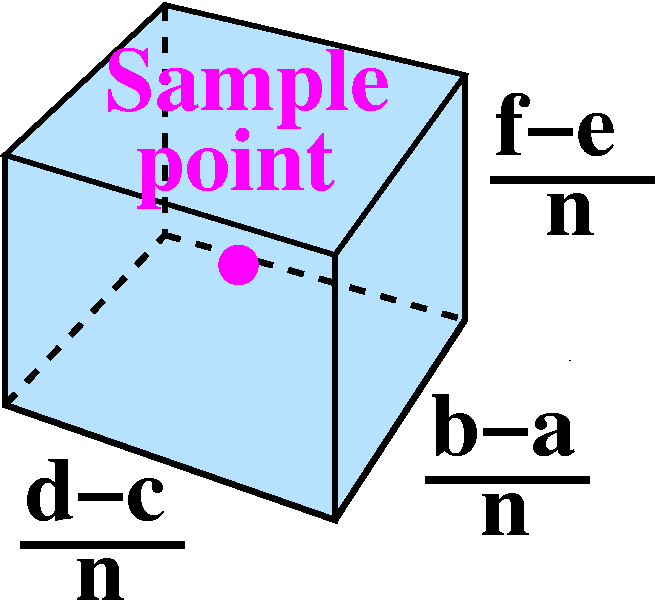 Just consider part of this, the fraction
(b–a)(d–c)(f–e)/n3. This is the same as
[(b–a)/n]·[(d–c)/n]·[(f–e)/n]. If n is large, this is
the same as splitting up each of the edges of the box into n equal
pieces, and what we have is a very small box of the ocean. Now if we
also want the points we measure to be well-distributed, then we might
expect that most of the boxes will contain exactly one sample point. We can think of
(Temperature at that sample point)·[(b–a)/n]·[(d–c)/n]·[(f–e)/n]
as T(that sample point)dx dy dz or as
T(that sample point)dV where dV is this very small box
inside the huge box of ocean. When we take the SUM we actually have an approximating Riemann
sum to ∫∫∫box of oceanT(x,y,z) dV, which is a
triple integral. Whew! The limit of such approximating sums is the
triple integral, but I won't go into detail because this all parallels
a similar discussion for double integrals. I don't want to forget
anything: there is a factor of (b–a)(d–c)(f–e) remaining on the
bottom, and this is the volume of the box.
Just consider part of this, the fraction
(b–a)(d–c)(f–e)/n3. This is the same as
[(b–a)/n]·[(d–c)/n]·[(f–e)/n]. If n is large, this is
the same as splitting up each of the edges of the box into n equal
pieces, and what we have is a very small box of the ocean. Now if we
also want the points we measure to be well-distributed, then we might
expect that most of the boxes will contain exactly one sample point. We can think of
(Temperature at that sample point)·[(b–a)/n]·[(d–c)/n]·[(f–e)/n]
as T(that sample point)dx dy dz or as
T(that sample point)dV where dV is this very small box
inside the huge box of ocean. When we take the SUM we actually have an approximating Riemann
sum to ∫∫∫box of oceanT(x,y,z) dV, which is a
triple integral. Whew! The limit of such approximating sums is the
triple integral, but I won't go into detail because this all parallels
a similar discussion for double integrals. I don't want to forget
anything: there is a factor of (b–a)(d–c)(f–e) remaining on the
bottom, and this is the volume of the box.
All of this is supposed to support the following definition:
The average value of the temperature in the box is
∫∫∫box of oceanT(x,y,z) dV
-------------------------
    Volume of the box
A specific example
What if our box was bounded by x=0 and x=2, y=0 and y=3, and z=0 and
z=5, and the temperature at (x,y,z) was given by the formula
T(x,y,z)=x2+7yz? Then if we wanted to compute the average
temperature we would convert a triple integral into a (triply)
iterated integral. In this case, I see no advantage in any one of the
six possible orders, so:
∫02∫05∫03
x2+7yz dy dz dx
Let's compute, from the inside out: ∫03
x2+7yz dy dz dx=yx2+(7/2)y2z]y=0y=3=3x2+(63/2)z.
∫053x2+(63/2)z dz=3x2z+(63/4)z2]z=0z=5=15x2+(63/4)(25).
∫0215x2+(63/4)(25) dx=5x3+(63/4)(25)x]x=0x=2=40+(63/2)(25).
If this were the 21st century instead of 1872, we could type:
> int(int(int(x^2+7*y*z,y=0..3),z=0..5),x=0..2);
                                    1655/2
Incidentally, I checked and 40+(63/2)(25) is the same as (1655)/2.
This isn't the average temperature. For that we need to divide by the
volume of the box which is 2·3·5=30. The result is
(331/6).
The "moral" of this: computation of triple iterated
integrals
I don't think that there are any essential new difficulties introduced
when we move from evaluating double iterated integrals to evaluating
triple iterated integrals. Yes, there are more opportunities for error
(50% more?) but they are not new in type. So I won't devote too much
time to actual evaluation, at least in this lecture.
Describing a volume in space
Since the difficulties involved in computation of a triple iterated
integral really are just those we've seen already with double
interated integrals, I want to illustrate something that definitely
seems more complicated to me: going from a description of a region in
space over which we want to compute a definite integral to the
corresponding iterated integrals (and there are 6=3! possible orders
for the iterated integral). Let me "integrate" (convert to iterated
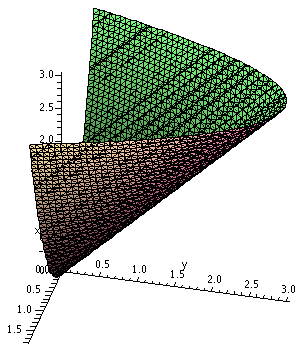
integrals) the function SQUIRREL over the region in space
(R3) defined by y=0, z=3, and z=x2+y.
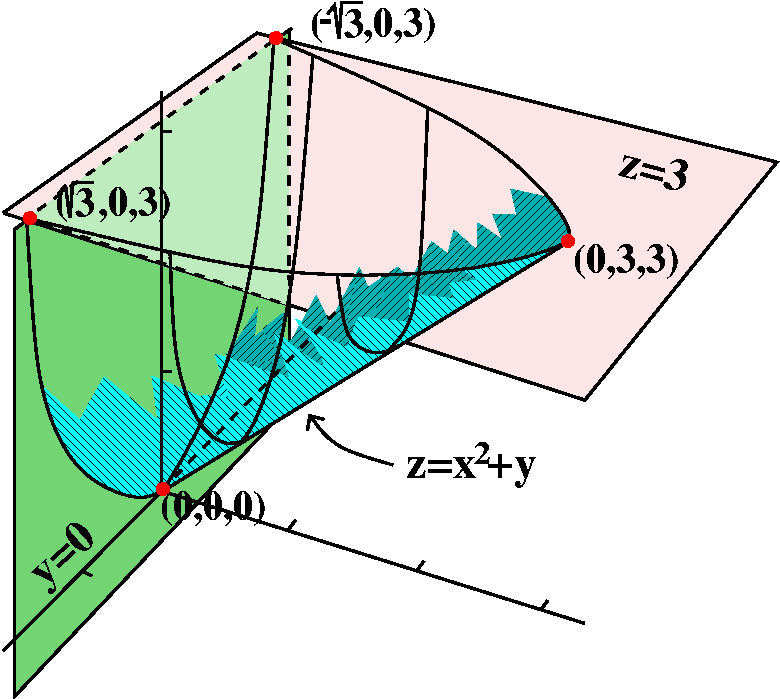 I want to
begin by sketching the region. The planes y=0 (the xz-plane) and z=3
(push the xy-plane up three units) are easy enough. The surface
z=x2+y cut by y=0 and z=3 is maybe not so obvious. When y=0
we get a parabolic arc cut off at z=3 in the xz-plane. As y increases,
the parabolic arc is translated up, but still cut off at z=3. In the
yz-plane, when x=0, the slice is a segment of the line z=y from (0,0)
(with the coordinates being y and z) to (3,3). The surface cuts the
plane z=3 with the parabola 3=x2+y or y=3–x2,
which opens "downward" (in the standard orientation of
xy-planes).
I want to
begin by sketching the region. The planes y=0 (the xz-plane) and z=3
(push the xy-plane up three units) are easy enough. The surface
z=x2+y cut by y=0 and z=3 is maybe not so obvious. When y=0
we get a parabolic arc cut off at z=3 in the xz-plane. As y increases,
the parabolic arc is translated up, but still cut off at z=3. In the
yz-plane, when x=0, the slice is a segment of the line z=y from (0,0)
(with the coordinates being y and z) to (3,3). The surface cuts the
plane z=3 with the parabola 3=x2+y or y=3–x2,
which opens "downward" (in the standard orientation of
xy-planes).
I've attempted to sketch the surface to the right of this description.
The colors are meant to show some of the curviness. There are some
extreme points which turn out to be
useful in setting up iterated integrals. Those are the points (0,0,0),
(0,3,3), (sqrt(3),0,3), and (–sqrt(3),0,3). These points are where
each of the coordinates (x and y and z) attain maximum and minimum
values on the solid regions whose boundary curves were given.
Nomenclature
The surface z=x2+y is called a tilted parabolic
cylinder. It is a parabolic cylinder because it results from a
family of parallel lines in space which all meet the parabola
z=x2 in the xz-plane. It is "tilted" because these lines
are not perpendicular to the xz-plane.
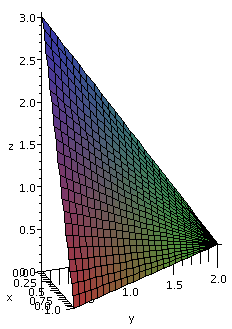
Now to the right is Maple's attempt to draw the tilted
parabolic cylinder in the region of interest to us. The picture to the
right is the result of using the command:
implicitplot3d(z=x^2+y,x=-1.75..1.75,y=0..3,z=0..3,
grid=[40,40,40],axes=normal,labels=[x,y,z]);
This command did not display an immediate result on my home
computer. It requested that Maple to check a
three-dimensional grid of 403=64,000 points, and then
compute the light and the angle, etc. I rotated and chose lighting so
that I got the image displayed here. That's why "supercomputers" are
needed to draw the lighting effects for Pixar, etc.
| |
Maple can draw ...
... some useful pictures for us when we want to look at double and
triple integrals. Last time we looked at the iterated integral
∫02∫x=0x=1–(1/2)y3–3x–(3/2)y dx dy
The command plot3d(3-3*x-(3/2)*y,x=0..1-(1/2)*y,y=0..2);
produces (after putting in the axes and making the view constrained) the graph shown to the right. I
did not know until fairly recently that Maple had the capacity to show only pictures
corresponding to double integral limits. This could be very helpful.
|
|
| |
A region in space
Now back to the triple integral. There are six different orders that
are possible when converting a triple integral to an iterated
integral. I did three of the six orders. Let's convert
∫∫∫This regionSQUIRREL dV into various iterated
triple integrals.
dx dy dz
I'll try this order first:
∫(
∫∫
SQUIRREL dx dy)dz.
I've mentioned that my personal inclination in finding limits of
iterated integrals is working from the outside-most limit "in". There
are definitely people who are successful and do the exact opposite. I
would recommend that you find your own "natural" style and try to
follow that path. For me, I would look at the z limits first. For this
shape, I would try to find the highest and lowest z's in the spatial
region. This is not a complicated region, and we've already sketched it quite well. The highest and lowest
z's are, respectively, z=0 and z=3. So we've got ∫z=0z=3(∫∫SQUIRREL dx dy)dz.
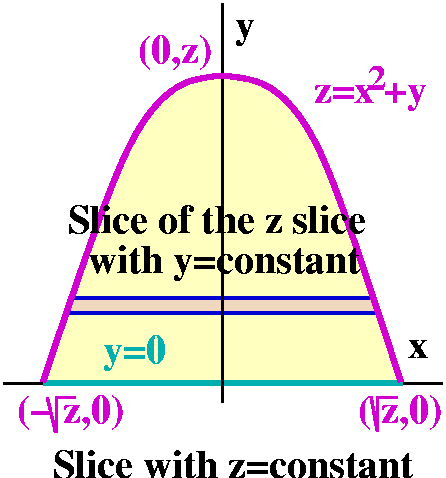 Now let's try slicing the region by z=CONSTANT, where the
CONSTANT is some unknown number between 0 and 3. This horizontal slice
of the original spatial region gets us something in the xy-plane. If
you were in class, you may recall that there was some effort involved
in sketching the slices that are shown here. But one boundary of the
sliced region is y=0, along the x-axis. The other, curved boundary, is
"inherited" from z=x2+y. Now z=CONSTANT so as a
curve in the xy-plane, if we write it in the standard
y=function of x format, we get
y=z–x2. Therefore this is a parabola (the square on x!)
opening down (the minus sign). The top of the parabola (the vertex)
occurs when x=0, and there y=z. The intersection(s) of the parabola
with the x axis occur when y=0, and there 0=z–x2, so that
x=±sqrt(z). The inner double integral is ∫∫
SQUIRREL dx dy. What are the bounds on the
dy integral? We must look at the slice, and see what the highest and lowest values of y are on the slice. The lowest value is 0 and highest value is z: but on the slice, z is a CONSTANT. The highest value depends on z. Now we know:
∫y=0y=z∫
SQUIRREL dx dy
Now let's try slicing the region by z=CONSTANT, where the
CONSTANT is some unknown number between 0 and 3. This horizontal slice
of the original spatial region gets us something in the xy-plane. If
you were in class, you may recall that there was some effort involved
in sketching the slices that are shown here. But one boundary of the
sliced region is y=0, along the x-axis. The other, curved boundary, is
"inherited" from z=x2+y. Now z=CONSTANT so as a
curve in the xy-plane, if we write it in the standard
y=function of x format, we get
y=z–x2. Therefore this is a parabola (the square on x!)
opening down (the minus sign). The top of the parabola (the vertex)
occurs when x=0, and there y=z. The intersection(s) of the parabola
with the x axis occur when y=0, and there 0=z–x2, so that
x=±sqrt(z). The inner double integral is ∫∫
SQUIRREL dx dy. What are the bounds on the
dy integral? We must look at the slice, and see what the highest and lowest values of y are on the slice. The lowest value is 0 and highest value is z: but on the slice, z is a CONSTANT. The highest value depends on z. Now we know:
∫y=0y=z∫
SQUIRREL dx dy
Now in the region pictured, I will slice with y=CONSTANT and see how
big and how small x can be. This is a slice of a slice (maybe
[slice]2?). So the boundary is given by z=x2+y,
and with both z and y CONSTANT, I get x2=z–y, so that
x=&plusnmn;sqrt(z–y). These will be the limits on the dx integral.
So the answer is:
∫z=0z=3∫y=0y=z∫x=–sqrt(z–y)x=+sqrt(z–y)
SQUIRREL dx dy dz.
dy dz dx
Now
∫(
∫∫
SQUIRREL dy dz)dx.
Examine the original picture and the limits on the
outermost variable, x, should be revealed. The largest and smallest
x's in this region are ±sqrt(3), and therefore we get ∫x=–sqrt(3)x=sqrt(3)(
∫∫SQUIRREL dy dz)dx. Our task is now to slice with x=CONSTANT and try
to get the other integrals' bounds.
Again, once the "picture" is presented then much of the remainder of
the work is made much easier. We spent some time in class drawing this
picture. When x=CONSTANT, then certainly the slice goes through the
side (on the xz-axis) so that y=0 becomes the left boundary, if we
have z assigned to be the vertical coordinate and take y to be the
horizontal coordinate. Also the top of the region is still z=3. The
other edge is "inherited" again as the effect of the equation
z=x2+y. As I mentioned in class, it is this edge which
irritates my highly trained mathematical psychology (is there such a
thing?). Notice that x=CONSTANT, so that z=x2+y is a
straight line in the yz-plane. The slope of this line is 1. And, when
y=0, z must be x2.
The limits on the outside of the double iterated integral ∫∫SQUIRREL dy dz can now be "read off" from
the picture, since the smallest value of z is x2 and the
largest value is 3. Therefore we have the limits on the outside of the
double iterated integral: ∫z=x2z=3∫SQUIRREL dy dz. Finally, the bounds on the
dy integral are obtained by slicing the slice. So now z=CONSTANT also,
and y goes from y=0 to the right side, which is a point on the line
(it still hurts to write this when there is a square in the equation!) z=x2+y, and therefore the upper bound is y=z–x2.
So the answer is:
∫x=–sqrt(3)x=sqrt(3)∫z=x2z=3∫y=0y=z–x2
SQUIRREL dy dz dx.
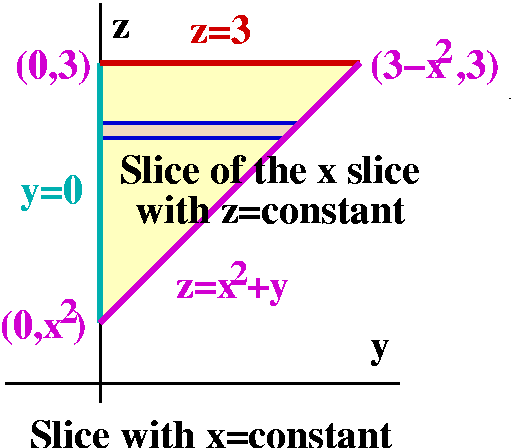
dz dx dy
My last attempt:
∫(
∫∫
SQUIRREL dz dx)dy.
Again, the picture shows that y in the solid region
varies from 0 to 3, and we've got 2 of the 6 limits (o.k., the easiest
of them): ∫y=0y=3(
∫∫
SQUIRREL dz dx)dy. The y=CONSTANT slice should give the other information.
Again, the picture gives much of the information we need. Drawing the
picture was some work. Here with y=CONSTANT, the top of the slice is
caused by the plane z=3. The bottom of the slice is
z=x2+y. Now since x is a variable, this is indeed a
parabola. The parabola opens up (positive coefficient on the square
term) and has vertex (0,y): the first coordinate is x and the second
coordinate in this slice is z. The parabola intersects the line z=3
when 3=x2+y. Since y=CONSTANT, this occurs when
x=±sqrt(3–y). The outer, x limits, on the double integral will be
x=–sqrt(3–y) and x=+sqrt(3–y). Now slice the slice, for make
x=CONSTANT also. z will vary. The highest value of z will be 3 on the
[slice]2. The lowest value of z is given by
z=x2+y.
The final way the poor SQUIRREL is chopped up and then
summed is
∫y=0y=3∫x=–sqrt(3–y)x=+sqrt(3–y)∫z=x2+yz=3SQUIRREL dz dx dy.
Comments
First, this is a classroom example. The solid region is actually not
very complicated. It is a convex region (nothing jutting out at
an angle) with boundaries given
by low-degree polynomials. The word convex means that line
segments whose ends are in the region always have the whole line
segment in the region. The problem would be much more complicated
if the functions defining the boundary weren't so simple, or if some
of the slices weren't convex (then we'd need to split up the
integrals, etc.). I remarked in class and I'll repeat here that the
process of finding these limits seems to be difficult, and hard to
describe -- I don't know yet of a computer program which can do it
reliably.
Here are the "answers" again:
∫z=0z=3∫y=0y=z∫x=–sqrt(z–y)x=+sqrt(z–y)
SQUIRREL dx dy dz
∫x=–sqrt(3)x=sqrt(3)∫z=x2z=3∫y=0y=z–x2
SQUIRREL dy dz dx.
∫y=0y=3∫x=–sqrt(3–y)x=+sqrt(3–y)∫z=x2+yz=3SQUIRREL dz dx dy.
I can't immediately see that the darn limits describe the same volume
in R3. Maybe you can. But you should see, just looking at
the patterns of the answers, what sorts of limits are "legal" and what
are not. You can only have variables in the limits if they haven't
been integrated yet. For example, in the last answer, the lower limit
of the innermost integral is z=x2+y, and the outside two
integrals are dx and dy. I could not have a limit in, say, the middle
integral of the form z=x2+y because there would be only one
variable left to be integrated, and there isn't any way to "kill" both
x and y. So there is a rough guide to the grammar (?) of the bounds on
iterated integrals.
How can you check this kind of "computation"?
Generally checking these things can be difficult and tedious. Luckily,
we are in the 21st century and I have powerful
friends. Well, I guess I can ask some electrons to run around. Look at
the following:
> W:=x^6*y^8*z^2;
                                      6  8  2
                                W := x  y  z

> int(int(int(W,x=-sqrt(z-y)..sqrt(z-y)),y=0..z),z=0..3);
                                            1/2
                              417942208512 3
                              -----------------
                                 5763232475

> int(int(int(W,y=0..z-x^2),z=x^2..3),x=-sqrt(3)..sqrt(3));
                                            1/2
                              417942208512 3
                              -----------------
                                 5763232475

> int(int(int(W,z=x^2+y..3),x=-sqrt(3-y)..sqrt(3-y)),y=0..3);
                                            1/2
                              417942208512 3
                              -----------------
                                 5763232475
I specified a "random" function, W, to replace SQUIRREL. I wanted the
antiderivatives not to be a problem, so I just specified some powers
of x and y and z. I asked Maple to
compute the triple iterated integrals using the three ways we
found. The answers are shown. They are such large and silly numbers,
and they all agree exactly. This makes me fairly confident the bounds
on the iterated integrals are correct.
How clever? Not very clever ...
I could have specified W=0, and then I bet the computation would
returned 0 for all of the setups. This answer would not be very
helpful. I could have specified W=1 and the result would be
(24/5)sqrt(3), the volume, for all of the setups. That would be
fine. In fact, I confess that the first W that I tried was actually
x3y7z2. Why wasn't this a very clever
choice, and what was the answer I got? Hint: 3 is odd and this
region in space is ...
The other orders
You may wish to check your "skill" by finding the limits on the other
three iterated integrals for SQUIRREL. Here you can check
your answers:
∫y=0y=3∫z=yz=3∫x=–sqrt(z–y)x=sqrt(z–y)SQUIRREL dx dz dy
∫z=0z=3∫x=–sqrt(z)x=sqrt(z)∫y=0y=z–x2
SQUIRREL dy dx dz
∫x=–sqrt(3)x=sqrt(3)∫y=0y=3–x2∫z=x2+yz=3SQUIRREL dz dy dx
These can all be (sort of!) read from the pictures above, and these
pictures were on the board at the end of class.
|
Tuesday, October 26, sections
12-14 and sections 15-17, lecture #16
Writeups, etc.
Learning to express yourself in written form about technical matters
is useful. Realizing that when you sign something with your name it
represents you is also important. So ... the writeups are a "baby" way
to get accustomed to these considerations.
More wild comments So I spent about 6 to 7
hours reading the writeups of sections 12 and 17. I tried to be
rather serious – I read what was handed in carefully. Some of
what I read, I was fairly sure, was written in less time than I
devoted to reading (!). I wanted to write useful
comments. Please try to learn from the comments, even if they seem
rather silly. It is not likely that future readers
will immediately love you (!): you should be persuasive and
logical. And, oh yes: write carefully.
 Volume of a tetrahedron
A tetrahedron is an object with flat sides having four
corners. I want to compute the volume of a tetrahedron whose corners
are at (0,0,0), (1,0,0), (0,2,0), and (0,0,3). There are several ways
to compute this volume, including some which need no "calculus", just
vector manipulation (using the triple product formula, for example
with a cross product and a dot product). To the right is an attempt at
a picture. It shows the corners (the four vertices) and the faces, and
I've made some attempt to show the four sides with differently
decorated "stripes" on each. There are four flat sides. One side is on
each coordinate plane (xy-, yz-, xz-) and there is a tilted face. The
equation of the tilted face (the points (1,0,0) and (0,2,0) and
(0,0,3) are on the tilted face) is x+(y/2)+(z/3)=1. I got this
equation by guessing (well, if Ax+By+Cz=1 is the equation, plug in the
various points).
Here we use a double integral to find the volume of the tetrahedron. I
think of this solid as lying over a triangle in the xy-plane. The
triangle is determined by (0,0), (1,0), and (0,2).The height of the
solid over this triangle is z=3–3x–(3/2)y, which the
equation for the tilted face gives by solving for z.
As a double integral
So the volume is ∫∫BaseHeight dA, and
this is ∫∫The triangle3–3x–(3/2)y dA. I'll convert
this to an iterated integral to compute it.
47 second break for theory
 In one variable calculus, the initial
glimpse at the theory in back of the definite integral assumes that
the function doesn't have any jumps. But real functions can
jump! The functions which are met in mechanical engineering (just hit
something!) can certainly look like what's shown to the right. And
similarly, functions met in digital signal processing really can look
like that also. They certainly can be integrated. The secret is that
the jumps really aren't very important. They can be put inside little
boxes where the variation doesn't matter very much (the red boxes in the picture). So the sums defining the
definite integral still approach a limit, the "correct" limit.
In one variable calculus, the initial
glimpse at the theory in back of the definite integral assumes that
the function doesn't have any jumps. But real functions can
jump! The functions which are met in mechanical engineering (just hit
something!) can certainly look like what's shown to the right. And
similarly, functions met in digital signal processing really can look
like that also. They certainly can be integrated. The secret is that
the jumps really aren't very important. They can be put inside little
boxes where the variation doesn't matter very much (the red boxes in the picture). So the sums defining the
definite integral still approach a limit, the "correct" limit.
Here I am apparently not even worrying about the domain. Well, this is
what we could do if we had another 30 minutes to fritter away on
details. I could define a function piecewise in this way:
F(x,y)=3–3x–(3/2)y if (x,y) is in the triangle, and F(x,y)=0 if (x,y)
is not in the triangle. Suppose R is any rectangle in the xy-plane
which contains the triangle. Then the volume of the tetrahedron would
be ∫∫RF(x,y) dA. I hope that you will see this
double integral is the same as the double integral over the triangle
that I'll compute by looking at iterated integrals. The
discontinuities of the piecewise-defined function turn out to give a
perturbation of the Riemann sums which →0 as the size of the pieces
→0. If the Riemann sum is gotten from an n-by-n partition, the
discontinuities would be located in at most 3n pieces, and
n2 is much bigger than 3n when n is large.
 Converting to iterated integrals
Let's write ∫∫The triangle3–3x–(3/2)y dA as a
dx dy iterated integral. That means figuring out the bounds on
the integrals.
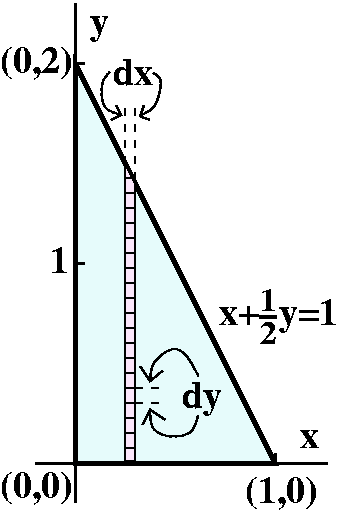
I will work from the outside in. So first I need to get the lowest and
highest values of y in the triangular base:
∫Lowest yHighest y∫???3–3x–(3/2)y dx dy
There's a sketch of the base to the right, and the sketch declares
that the Lowest y is 0 and the Highest y is 2. Now I
imagine (and frequently draw, as shown on the sketch!) a very thin
collection of dx by dy rectangles being added up in a row across the
region. It is so thin that y is almost constant and the x's range from
the leftmost edge to the rightmost edge. The left edge is certainly 0
always. But the right edge depends on y. When y is very near the
bottom (y=0), the right edge is very near 1. When y is near the top
(y=1), the right edge is near 0. What is the relationship between x
and y on this edge? Of course the edge reflects the tilted face of
the tetrahedron, which has the equation x+(y/2)+(z/3)=1. On the base,
z=0, so the equation giving the tilted side of the triangular base
must be x+(y/2)=1. Therefore x on the rightmost edge is given by
x=1–(1/2)y. Here is the resulting iterated integral:
∫02∫x=0x=1–(1/2)y3–3x–(3/2)y dx dy
Even thought it is not logically necessary (because the dx dy
notation does determine what variable is integrated first), I do tend
to write "x=" on the limits of the inner integrals. This may save me
from confusion and error as I compute.
Computing the iterated integral
I'll first compute the inner integral:
∫x=0x=1–(1/2)y3–3x–(3/2)y dx=
(antidifferentiate with respect to x, so y is a constant here!)
3x–(3/2)x2–(3/2)yx]x=0x=1–(1/2)y=
3{1–(1/2)y}–(3/2){1–(1/2)y}2–(3/2)y(1–(1/2)y)–0. The –0 comes from the lower limit, x=0. I tend to expand and "simplify" here. So we get:
3–(3/2)y–(3/2){1–(1/2)y}2–(3/2)y(1–(1/2)y)=3–(3/2)y–(3/2){1–y+(1/4)y2}–(3/2)y+(3/4)y2=
(3/2)–(3/2)y+(3/8)y2
Now the outer integral:
∫02(3/2)–(3/2)y+(3/8)y2dy=(3/2)y–(3/4)y2+(1/8)y3]02=(3/2)(2)–(3/4)(4)+(1/8)(8)=1.
Maybe it should be "clear" to me that the volume is 1, but it isn't.
 The other iterated integral
Now, just to practice, we'll write ∫∫The triangle3–3x–(3/2)y dA as a
dy dx iterated integral.
Again, I will work from the outside in. So first I need to get the
leftest (leftmost) and rightest (rightmost) values of x in the
triangular base:
∫Leftmost xRightmost x∫???3–3x–(3/2)y dy dx
Now the base triangle is again shown to the left, but with the kind of
"doodles" that I would make suitable to finding the limits of a
dy dx iterated integral. The leftmost value of x is 0 and the
rightmost value of x is 1. Now my dx by dy triangles form a vertical
strip where x is just about constant. For the inner limits on y I need
to know that the strip goes from the bottom, where y=0, to the
top. The top will vary, depending on x. The equation of the boundary
line for the top is the same: x+(y/2)=1. Now we need to know y as a
function of x. So solve for y and get y=2–2x. That's the upper limit
on the dx integral. Here is the resulting iterated integral:
∫01∫y=0y=2–2x3–3x–(3/2)y dy dx.
Computing the iterated integral
I'll first compute the inner integral:
∫y=0y=2–2x3–3x–(3/2)y dy=
(antidifferentiate with respect to y, so x is a constant here!)
3y–3xy–(3/4)y2]y=0y=2–2x=
3(2–2x)–3x(2–2x)–(3/4)(2–2x)2–0. Again, the –0 comes from the lower limit, y=0. Now expand and simplify:
6–6x–6x+6x2–(3/4){4–8x+4x2}=3–6x+3x2
The outer integral:
∫013–6x+3x2dx=3x–3x2+x3]01=3–3+1=1.
Thank goodness, we got 1 again.
Possible sources of error in these computations
I'm looking ahead a little bit here. We will discuss triple integrals
next time, and these are also usually computed by a transition to
triple iterated integrals. There are six possible orders for iterated
triple integrals. I make errors frequently. The prominent sources of
error include: antidifferentiating with respect to the wrong variable,
substituting for the wrong variable, and, well, general
confusion. Please try to guard against these. You may make these
errors, and just do the computation again, and try to keep your
composure intact ("Keep cool, y'know!").
By the way, although I wanted our first example to be as easy as
possible, when I was typing up the diary notes above, I ... made
several errors and had to go back and redo things. Oh well.
Another one
The base of a solid is the region in the first quadrant of the
xy-plane bounded by the curve y=x2 and the line y=3x. The
height over the xy-plane is given by
z=x6y7. Find the volume of this solid.
The double integral is ∫∫BaseHeight dA, and
this is ∫∫The shapex6y7 dA.
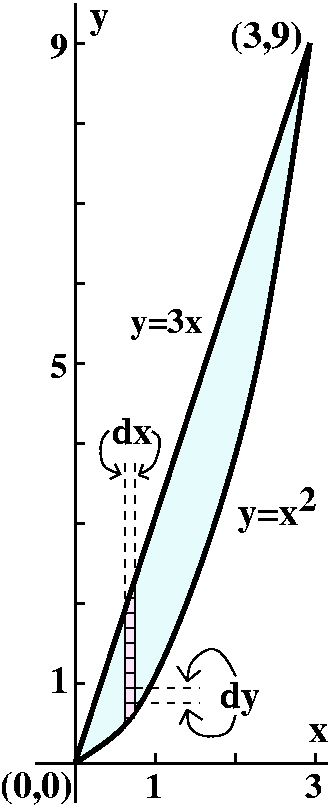
One iterated integral, with its computation
We will convert this first to a dy dx integral. The outside
limits come first. The most left x gets on the base is x=0. The most
right x gets is x=3. We know this because we graphed the base, and
found the intersection points of y=x2 and y=3x by solving
3x=x2, which has roots at x=0 and x=3. Therefore the
iterated integral looks like:
∫03∫???x6y7dy dx
What about the limits on y? Here the sketch of the base, together with
my doodles, may be useful. The vertical strip of boxes tells me that I
should add up things from y=x2, the lower bound, to y=3x,
the upper bound. Therefore this iterated integral is:
∫03∫y=x2y=3xx6y7dy dx
Now to compute the integral. The inner integral:
∫y=x2y=3xx6y7dy=(1/8)x6y8]y=x2y=3x=(1/8)x6(3x)8–(1/8)x6(x2)8.
This "simplifies" to
(1/8)38x14–(1/8)x22. (I am using the
powerful rules of exponential manipulation here!) And now the outer
integral:
∫03
(1/8)38x14–(1/8)x22dx=
(1/8)38(1/15)x15–(1/8)(1/23)x23]03=
(1/8)38(1/15)315–(1/8)(1/23)323=(1/8)323([1/15]–[1/23]). Wow!
The other iterated integral, with its computation
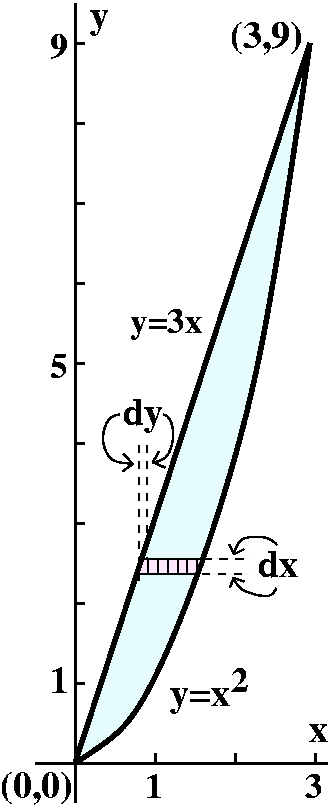 Now for the dx dy integral. The highest and lowest values for y
are 0 and 9. Therefore the integral must be:
Now for the dx dy integral. The highest and lowest values for y
are 0 and 9. Therefore the integral must be:
∫09∫???x6y7dx dy
Now we need to consider a (fixed) y slice through the base. The
left-hand side of that fixed y slice is determined by y=3x and the
right-hand side of the slice is determined by y=x2. We need
to know the limits on x in terms of y. So we need to know
x=Left(y) and x=Right(y). That means "solving for x" in the boundary
equations. This (here, in this classroom example!) is not too
hard. y=3x becomes x=(1/3)y on the left, and y=x2 becomes
x=sqrt(y) on the right. The positive square root gets used here
because (picture!) we're in the first quadrant. The iterated integral
is:
∫09∫x=(1/3)yx=sqrt(y)x6y7dx dy
The computation begins with the inner integral.
∫x=(1/3)yx=sqrt(y)x6y7dx=(1/7)x7y8]x=(1/3)yx=sqrt(y)=
(1/7){sqrt(y)}7y7–(1/7){(1/3)y}7y7=(1/7)y7/2y7–(1/7)(1/3)7y7y7
This now "simplifies" (what a silly word!) to
(1/7)y(21)/2–(1/7)(1/3)7y14. Now the
outside:
∫09(1/7)y(21)/2–(1/7)(1/3)7y14dy=
(1/7)(2/(23))y(23)/2–(1/7)(1/3)7(1/15)y15]09=
(1/7)(2/(23))9(23)/2–(1/7)(1/3)7(1/15)915=
(1/7)(2/(23))323–(1/7)(1/3)7(1/15)330=
(1/7)(2/(23))323–(1/7)(1/15)323=(1/7)323([2/(23)]–[1/15])
Theorem
 1     / 1      1  \     1    / 2      1  \
--- · | ---- - ---- | = --- ·| ---- - ---- |
 8     \ 15     23 /     7    \ 23     15 /
The proof consists of observing that the dx dy and
dy dx values of the double integral must be equal by the Fubini
result, and then dividing both values by 323. (The student
may, of course, verify this statement using the tools of third grade
arithmetic, but the prestige of double integrals is ... [priceless?].)
This "theorem" may be the silliest statement of the course.
More on difficulties and on the psychology of the individual
Please don't panic. If you want to compute a double integral, you
don't need to do both iterated integrals -- just one of them. I
chose to do both to show you how (I hope!).
Notice that we needed to go from one description of the boundary
curves: {y=3x, y=x2}, to another: {x=(1/3)y,x=sqrt(y)},
when we did dx dy after dy dx. "Solving" (finding a
convenient form for inverse functions) may be difficult (or even
impossible in terms of familiar functions).
One last remark: I almost always try to find the bounds on iterated
integrals going from the outside-most integral to the inside-most
integral. Some people may find the transition from inside to outside
more easy (this difference in approach will be more emphatic when we
do triple integrals). You should try a series of examples and settle
upon what you find most comfortable. And remember that you can always
"change" to the other way.
By the way ...> int(int(x^6*y^7,x=(1/3)*y..sqrt(y)),y=0..9);
31381059609
-----------
115
> int(int(x^6*y^7,y=x^2..3*x),x=0..3);
31381059609
-----------
115
So Maple gets the same answer both ways, also.
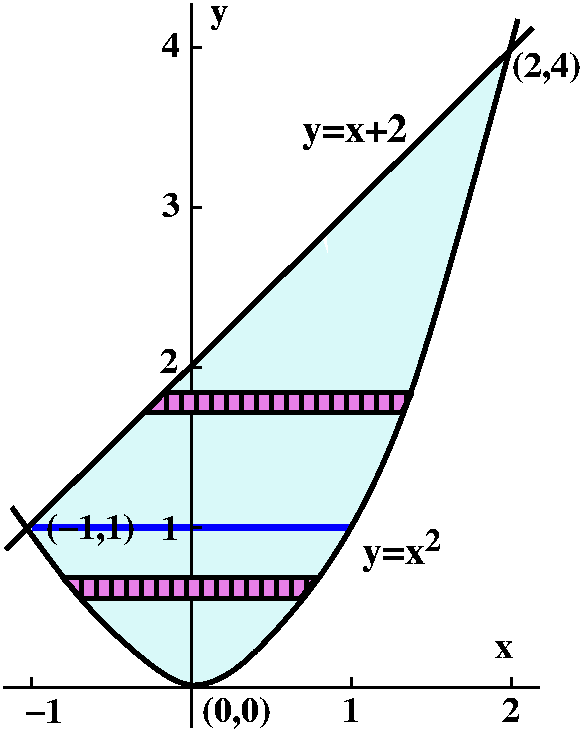 Integrating Frog over a region
If the integrand (the function to be integrated) is not too weird,
then I hope you should be convinced that the actual
antidifferentiations probably aren't the essential difficulty. The
difficulty is more in setting up the iterated integrals:
finding the bounds. Here is a more complicated example.
The region R is bounded by y=x+2 and y=x2. What does this
region look like? Well, this is a problem in a calculus course, so
solving x2=x+2 shouldn't be impossible. In fact, this leads
to x2–x–2=0 which is (x–2)(x+1)=0 so intersections occur
when x=–1 (so y=(–1)2=1) and when x=2 (so
y=22=4). I would like to integrate Frog over the region R:
∫∫RFrog dA. More precisely,
I'd just like to set up the bounds of the iterated integrals which are
equal to this double integral.
Totally randomly, dx dy first
The dx dy order introduces an additional kind of
complexity. Consider these limits:
∫Bottom of yTop of
y∫x=Left(y)x=Right(y)Frog dx dy.
The Top of y and Bottom of y are easy enough. In the region R, the
smallest y value is 0 and the largest y value is 4. Now think about
x=Left(y) and x=Right(y). The thick horizontal
blue line in the sketch separates different formulas for
the Left limit of x as a function of y. Below it, the Left limit is
determined by the left-hand side of the parabola. Above it, the Left
limit is determined by the straight line. Theoretically this does not
cause any problems. But when you're actually trying to compute
everything, what people usually do is separate the pieces:
∫01∫x=Left(y)x=Right(y)Frog dx dy +∫14∫x=Left(y)x=Right(y)Frog dx dy.
In the first iterated integral, as y goes from 0 to 1, the left and
right boundaries are both given by formulas related to
y=x2. Here x=+/–sqrt(y), so Left(y)=–sqrt(x) and
Right(y)=+sqrt(x). In the second iterated integral, y goes from 1 to
4. Here also Right(y)=+sqrt(x), but Left(y) comes from y=x+2, so
Left(y)=y–2. So the dx dy iterated integrals which are
equal to the double integral are:
∫01∫x=–sqrt(y)x=sqrt(y)Frog dx dy +∫14∫x=y–2x=sqrt(y)Frog dx dy.
Now dy dx
This one is much easier. I can read off the left and right extreme
values of x, and then the y boundary values are given by the equations
which already "present" the region R. I don't need to split up
things. Here it is:
∫–12∫y=x2y=x+2Frog dy dx.
Almost surely, unless circumstances were very strange, I would set up
the iterated integral this way and not in the dx dy way.
The New
Jersey Chorus Frog, Pseudacris feriarum kalmi, is an
endangered species in some of its
range.
|
A problem from a calculus textbook
This problem shows one further "wrinkle" that can occur with double or
triple or any kind of "multiple" integral. Here's the statement:
Evaluate the double integral ∫∫Dex/ydA, where D={(x,y)|1≤y≤2,
y≤x≤y3}.
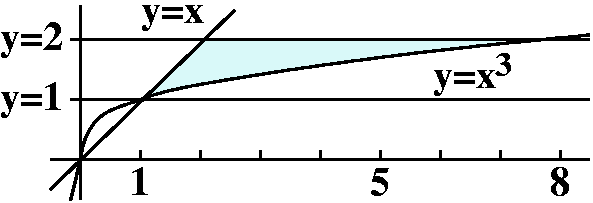 As to why this problem introduces a new kind of complexity, I invite
you to ask Maple to integrate ex/y both dx and dy.
That is, what are the respective antiderivatives? The x antiderivative
is yex/y but there is no y antiderivative in terms
of familiar functions. So if we want to get an answer to the
textbook's problem, we'd better first do dx and then leave dy until
later.
As to why this problem introduces a new kind of complexity, I invite
you to ask Maple to integrate ex/y both dx and dy.
That is, what are the respective antiderivatives? The x antiderivative
is yex/y but there is no y antiderivative in terms
of familiar functions. So if we want to get an answer to the
textbook's problem, we'd better first do dx and then leave dy until
later.
The dx dy double integral is easy enough to write, because the region D is described suitably:
∫12∫x=yx=y3ex/ydx dy
The inner antidifferentiation gives
∫x=yx=y3ex/ydx=yex/y]x=yx=y3=yey3/y–ye1=yey2–ey
and then ∫12yey2–ey dy is just
(1/2)ey2–(e/2)y2]12=(1/2)e4–2e.
Comment
I do know some examples, in "real" applications, not textbooks, where
looking at the order of the iterated integrals changes something
really nasty into a function which can be handled routinely. So,
although this is a textbook/class example, it does show an idea which
may be useful.
I did "ask" Maple for the antiderivative
of e1/y. Its reply contained something I wasn't familiar
with. When I asked for help, I
essentially was told that this was a function whose derivative was
e1/y. In other words, Maple
responded to the question, "What's the antiderivative of
e1/y" with the statement, "The antiderivative of e1/y."
Such a reply may not be useful.
|
QotD
Consider the iterated double integral
∫x=0x=2∫y=0y=4–x2TOAD dy dx. I'd like two tasks
done:
- Sketch the region in the plane over which this integral is
computed.
- Write the integral as an iterated double integral in dx dy
order. You can't "compute" it since I haven't told you anything
about TOAD, so the answer to this
part is something of the form
∫y=CONSTANT1y=CONSTANT2∫x=ALGEBRA1x=ALGEBRA2 TOAD dy dx where
ALGEBRA1 and
ALGEBRA2 may include y's (but they don't
have to). CONSTANT1 and
CONSTANT2 must just be numbers with
no x's or y's.
To the right is Maple's answer to the
first question. The answer was obtained with several commands.
First, I used
plot3d(0,x=0..2,y=0..4-x^2,scaling=constrained,axes=normal,
color=yellow,style=patchnogrid,orientation=[-90,0]);
to get a "yellow" (looks more mustard-color to me!) region. Then I used
spacecurve(<t,4-t^2,0>,
t=0..2,color=black,thickness=2,orientation=[-90,0]);
to get a black boundary curve. I combined these pictures with a
display3d command.
I believe that the answer in dx dy order is
∫y=0y=8∫x=0x=sqrt(4–y) TOAD dx dy.
The equation y=4–x2 becomes x2=4–y which becomes
in turn x=sqrt(4–y).
| 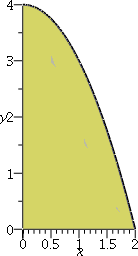 |
Check, please!
How could I possibly check this answer, since no one is looking at my
work? Well, a preliminary check might be to ask my friend this:
> int(int(1,y=0..8-x^3),x=0..2);
                                     12
> int(int(1,x=0..(8-y)^(1/3)),y=0..8);
                                     12
Maybe, though, I was just lucky: there aren't many small integers, so
it is possible that the answers are just accidentally equal (really:
such things do happen). But if I see what follows, my emotional (?)
confidence (??) in my answer is considerable strengthened, because it
seems highly unlikely that such bizarre answers could "accidentally"
be the same. I am considerably encouraged that my answer is correct:
> int(int(3*x^5+5*y^7,y=0..8-x^3),x=0..2);
                                371507663104
                                ------------
                                   40755
> int(int(3*x^5+5*y^7,x=0..(8-y)^(1/3)),y=0..8);
                                371507663104
                                ------------
                                   40755
|
Thursday, October 21, sections
12-14, and Friday, October 22, sections 15-17, lecture #15
Quick review of the definite integral in calc 1
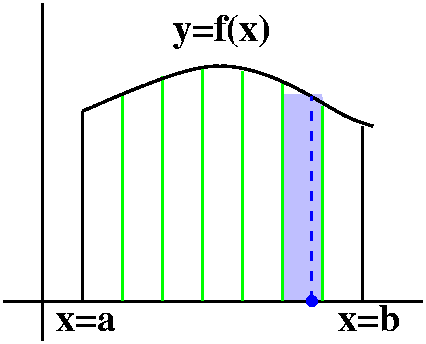 Suppose we have a nice function f(x) of one variable defined on and
interval, [a,b]. We might want to find the area under y=f(x) on that
interval, althogh that is more of an excuse to define the definite
integral than a real ambition. Here is one approach to the
definition. Take a large positive integer n and divide [a,b] into n
equal parts each of width Δx=(b–a)/n. In each subinterval
choose a sample point, say qj in the jth
subinterval. Compute the sum
∑j=1nf(qj)Δx. This is
a Riemann sum approximating the definite integral. As
n→∞, any sequence of sums is supposed to approach a unique
limit, and that limit is the definite integral.
Suppose we have a nice function f(x) of one variable defined on and
interval, [a,b]. We might want to find the area under y=f(x) on that
interval, althogh that is more of an excuse to define the definite
integral than a real ambition. Here is one approach to the
definition. Take a large positive integer n and divide [a,b] into n
equal parts each of width Δx=(b–a)/n. In each subinterval
choose a sample point, say qj in the jth
subinterval. Compute the sum
∑j=1nf(qj)Δx. This is
a Riemann sum approximating the definite integral. As
n→∞, any sequence of sums is supposed to approach a unique
limit, and that limit is the definite integral.
This is a major result in calculus.
There are many choices of sample points, and it really isn't clear
that the choices don't influence the limit. But this is true and
remarkable!
Theorem For any choices of sample points, as n→∞, the
Riemann sums→a unique limit, the definite integral of f from a to b,
and written ∫abf(x) dx.
Of course the integral sign and the dx's are notation to remind people
of the approximating sums. We could approximate the definite integral
with Riemann sums, and of course there are many other numerical
approximation schemes. But the champion method for computing the
definite integral is:
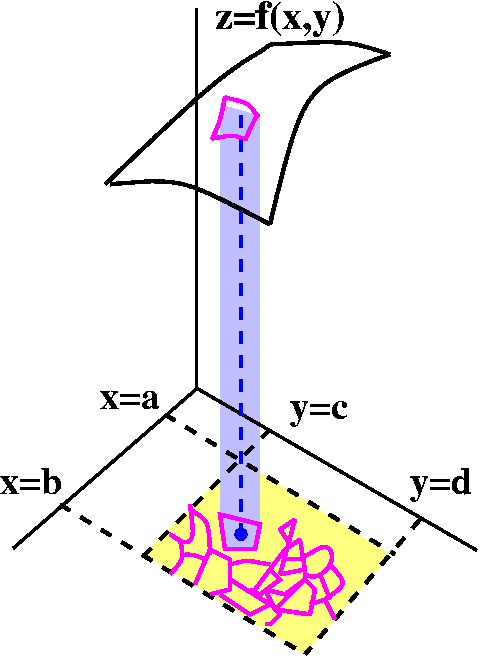 FTC If F´=f, then ∫abf(x) dx=F(b)–F(a).
Defining the double integral
The definition more or less parallels the single integral
definition. I'll follow the text closely here. We begin with a nice
function (say, continuous) defined on a rectangle R in R2
with boundaries x=a, x=b, y=c, and y=d. Chop up the area of the
rectangle into a bunch of chunks. In each chunk, choose a sample
point. Compute the corresponding Riemann sum, the sum over all the
chunks of f's value at the sample point multiplied by the area of the
chunk. If f(x,y)>0 on R, then this Riemann sum approximates the
volume under z=f(x,y) and over R. Then it's true that as the maximum
size of the chunks→0 (here the best way to measure "size" is by
diameter rather than, say, area), the Riemann sums→a unique
limit. This limit is the double integral over R of f(x,y):
∫∫Rf(x,y)dA. This is a mathematical abstraction of
the volume. The volumes computed as a result of formulas in earlier
calculus (solids of revolution, solids with simple cross-sections,
etc.) take advantage of symmetry. The theoretical tool defined here
allows us to compute volumes without any simple kinds of symmetry. As
I mentioned in class, numerical computations of double integrals (and
other higher-dimensional creatures) are sometimes necessary, but the
computations get much more intricate than the simple ideas shown in
calc 2.
Almost all the computations of volumes that I've made in my life have
occurred as a result of teaching third semester calculus. Maybe the
following is a bit more interesting.
Mass of a plate
 Maybe this is a more realistic "scenario". Suppose you are given a
thin rectangular metal plate with an unknown density
distribution. Therefore this is not necessarily a homogeneous
thin plate. The plate is too heavy or too unwieldy to weigh directly,
and you need to estimate the total mass. Also the mass distribution --
the density -- is not necessarily given by a simple formula. What
maybe could be done is tiny Samples taken at various parts of the
plate, according to some method (maybe depending on accessibility or
expense or ... anything). Then these samples could have their density
measured, and maybe then, after dividing the plate (thoughtwise!) into
pieces, the sample densities could be multiplied by the areas of the
pieces. The sum of these products would then be an estimate for the
mass in the plate. (It is a Riemann sum.) If a better (more accurate?)
estimate was wanted, maybe then use more sample points, smaller areas,
etc. The process is exactly the same mathematics as the definition of
the double integral.
Maybe this is a more realistic "scenario". Suppose you are given a
thin rectangular metal plate with an unknown density
distribution. Therefore this is not necessarily a homogeneous
thin plate. The plate is too heavy or too unwieldy to weigh directly,
and you need to estimate the total mass. Also the mass distribution --
the density -- is not necessarily given by a simple formula. What
maybe could be done is tiny Samples taken at various parts of the
plate, according to some method (maybe depending on accessibility or
expense or ... anything). Then these samples could have their density
measured, and maybe then, after dividing the plate (thoughtwise!) into
pieces, the sample densities could be multiplied by the areas of the
pieces. The sum of these products would then be an estimate for the
mass in the plate. (It is a Riemann sum.) If a better (more accurate?)
estimate was wanted, maybe then use more sample points, smaller areas,
etc. The process is exactly the same mathematics as the definition of
the double integral.
Reality?
Well, you might work for Schlumberger and your sample points
might cost three to five million dollars each as you try to
investigate the oil or gas quantities of some region. You'd then
really think a bit about the whole process. And that's what they do.
|
Some very simple examples of double integrals
I did some examples similar to these.
Example A The rectangle R is defined by x=3 and x=7 and y=5 and
y=8. The function is f(x,y)=700. Then ∫∫Rf(x,y)dA is 700(7–3)(8–5). Of course, I am using the
fact that the volume described by the double integral is the volume of
a rectangular solid with edge dimensions 700 and 7–3 and 8–5.
Example B Here I took f(x,y) to be
5–x2+y2, definitely a more complicated function
than the previous example's. The rectangle I took was defined by x=–3,
x=3, y=–3, and y=3. Let's temporarily discard the 5 and concentrate on
–x2+y2. If I interchange x and y the sign of the
function's value changes. But the rectangular domain is symmetric
about (0,0), so the net value (+'s and –'s cancelling!) of the double
integral of –x2+y2 over the rectangle is 0
(!). Now I "integrate" the 5, and the result is 5(3–(–3))(3–(–3)). So
we did have a more complicated function but the choice of domain made
the hard part of the function drop out.
Basic properties
The basic properties of the double integral are exactly like those of
the 1-dimensional version.
- Linearity If f and g are both nice functions defined on the rectangle R,
then ∫∫Rf(x,y)+g(x,y)DA=∫∫Rf(x,y)dA+∫∫Rg(x,y)dA; if k is a constant, then ∫∫Rkf(x,y)dA=k∫∫Rf(x,y)dA.
- Order If f(x,y)≤g(x,y) for all points (x,y) in the
rectangle, then ∫∫Rf(x,y)dA≤∫∫Rg(x,y)dA.
How to compute?  Maybe all this theory is very nice, but let me show you
the way most double integrals are computed. One method of chopping up
a rectangle is to use vertical and horizontal lines, parallel to the
sides. So we get a grid of subrectangles, each Δx by Δy,
with both Δ's very small. In addition to choosing this special
chopping strategy we could also decide to add up the contributions
(the f(sample point)ΔxΔy) in an orderly manner. So,
for example, we could add up the contributions from the lowest "row"
first. In that row, since Δy is small, y hardly varies at
all. The sum of a row sure looks like the definite integral with
respect to x only for "that" value of y. The same can be done for each
row. When the row sums are done, we now have the y's to worry
about. But this is a y integral. Of course, a completely symmetric
procedure can be used in the other order: first dy, with x held
constant, and then dx. Again what's here is not a "proof" (this is not
too difficult, actually) but I hope the discussion supports the
following result.
Maybe all this theory is very nice, but let me show you
the way most double integrals are computed. One method of chopping up
a rectangle is to use vertical and horizontal lines, parallel to the
sides. So we get a grid of subrectangles, each Δx by Δy,
with both Δ's very small. In addition to choosing this special
chopping strategy we could also decide to add up the contributions
(the f(sample point)ΔxΔy) in an orderly manner. So,
for example, we could add up the contributions from the lowest "row"
first. In that row, since Δy is small, y hardly varies at
all. The sum of a row sure looks like the definite integral with
respect to x only for "that" value of y. The same can be done for each
row. When the row sums are done, we now have the y's to worry
about. But this is a y integral. Of course, a completely symmetric
procedure can be used in the other order: first dy, with x held
constant, and then dx. Again what's here is not a "proof" (this is not
too difficult, actually) but I hope the discussion supports the
following result.
Fubini's Theorem
Suppose f(x,y) is a continuous function in a rectangle R defined by
x=a, x=b, y=c, and y=d. Then
∫∫Rf(x,y)dA=∫cd∫abf(x,y)dx dy=∫ab∫cdf(x,y)dy dx.
Comments The first "creature" in the equation above is called a
double integral. The two others are officially called
iterated integrals: iterated means "repeated" (you m ight think
that these things should be called "partial integrals" in analogy with
partial derivatives, but ... they are not). Technically and precisely
these two kinds of integrals are different creatures. Also please note
that the outside integration limits go with the outside d-variable --
sometimes this can be confusing. When it is, I write things like "x=a"
instead of just "a" so I don't confuse myself.
Example 1
Let me try to compute
∫∫R x3y7dA where R is the
rectangle defined by x=1, x=4, y=2 and y=5. The Fubini Theorem allows
me to "trade in" the double integral for an iterated integral, either
dx dy or dy dx. There are some occasions where one order or
the other might be preferable (we'll see this later) but here I don't
think that happens. So:
∫∫Rx3y7dA=∫25∫14x3y7dx dy.
I'll begin by computing the inner integral:
∫14x3y7dx=(1/4)x4y7]14.
In this antidifferentiation, the y7 is a constant (this is,
not surprizingly, exactly the inverse of partial
differentiation). Then we evaluate and get
(1/4)44y7–(1/4)14y7=(255/4)y7.
I remarked in class that I sometimes lose my way in these
computations, and need to write
(1/4)x4y7]x=1x=4
to insure that I remember to substitute for the correct variable.
Now ∫25(255/4)y7dy=(255/4)(1/8)y8]25=(255/4)(1/8)58–(255/4)(1/8)28.
My silicon buddy ...
A report from Maple:> int(int(x^3*y^7,x=1..4),y=2..5);
99544095
--------
32
|
 Example 2
Let's compute ∫∫Rf(x,y) dA where R
is the rectangle shown to the right and determined by these
inequalities: 0≤x≤Π/4 and –Π/2≤y≤Π, and
where f(x,y)=cos(2x+3y).
One order was done in class, and the other was, how wonderful, the
QotD!
Let me try this dy dx. So:
∫x=0x=Π∫y=–Π/2y=Πcos(2x+3y)dy dx
- FTC in y (the inner integral):
∫y=–Π/2y=Πcos(2x+3y)dy=(1/3)sin(2x+3y)]y=–Π/2y=Π=(1/3)sin(2x+3Π)–(1/3)sin(2x–3Π/2).
- FTC in x (the outer integral):
∫x=0x=Π/4(1/3)sin(2x+3Π)–(1/3)sin(2x–3Π/2)dx=–(1/6)cos(2x+3Π)+(1/6)cos(2x–3Π/2)]x=0x=Π/4=
(–(1/6)cos(7Π/2)+(1/6)cos(–2Π/2))–(–(1/6)cos(3Π)+(1/6)cos(–3Π/2))=
(–(1/6)0+(1/6)(–1))–(–(1/6)(–1)+(1/6)0)=–1/3.
Now, just for fun (?), I'll do this dx dy. So:
∫y=–Π/2y=Π∫x=0x=Πcos(2x+3y)dx dy
- FTC in x (the inner integral):
∫x=0x=Π/4cos(2x+3y)dx=(1/2)sin(2x+3y)]x=0x=Π/4=(1/2)sin(Π+3y)–sin(0+3y).
- FTC in y (the outer integral):
∫y=–Π/2y=Π(1/2)sin(Π+3y)–(1/2)sin(3y)dy=
–(1/6)cos(Π+3y)+(1/6)cos(3y)]y=–Π/2y=Π=
(–(1/6)cos(4Π)+(1/6)cos(3Π))–(–(1/6)cos(–Π/2)+(1/6)cos(–3Π/2))=
(–(1/6)1+(1/6)(–1)))–(–(1/6)0+(1/6)0)=–1/3.
If it helps, I'll admit that I had to do these computations several
times in order to have the answers the same even though I really don't
believe that this specific double integral is very complicated!
Or, of course
> int(int(cos(2*x+3*y),y=-Pi/2..Pi),x=0..(1/4)*Pi);
                                            -1/3
> int(int(cos(2*x+3*y),x=0..(1/4)*Pi),y=-Pi/2..Pi);
                                            -1/3
|
APOLOGY to sections 15, 16, & 17
So I computed the double integral on Friday, October 22, on the
region defined by 0≤x≤Π/4 (that's fine) but also with
the y restriction –Π/4≤x≤Π (so the lower y
bound is different from what I wanted).
The answer is
(sqrt(2)/6)–1/6 as we got in class.
Certainly this is not as simple
and "nice" as the –1/3 answer I anticipated. I'm sorry that I
made this mistake.
|
Tuesday, October 19, sections
12-14 and sections 15-17, lecture #14
More max/min "review" from 1 variable calculus
In one variable calculus, the study of max/min included both local max
and min and also max and min in an interval. The theoretical result
which supports this is the following:
A continuous function on a closed bounded interval always attains its
maximum and its minimum.
 The theoretical justification of this statement is rarely mentioned in
calc 1, but usually some examples are presented to show that the
assumptions are needed. So: in an open interval, not containing its
endpoints, a continuous function need not attain its min or its max
(consider tan(x) on (–Π/2,Π/2) for example). And a function
which is NOT continuous on a closed bounded interval need not attain
its min or its max (consider the piecewise function f(x)=1/x for
x≠0 and f(x)=0 on the interval [–1,1], for example).
The theoretical justification of this statement is rarely mentioned in
calc 1, but usually some examples are presented to show that the
assumptions are needed. So: in an open interval, not containing its
endpoints, a continuous function need not attain its min or its max
(consider tan(x) on (–Π/2,Π/2) for example). And a function
which is NOT continuous on a closed bounded interval need not attain
its min or its max (consider the piecewise function f(x)=1/x for
x≠0 and f(x)=0 on the interval [–1,1], for example).
|
When we hunted for extrema (max/min) on a closed bounded interval,
then we had to check both the interior critical points and the end
points.
The theory in >1 variable
A similar theoretical result is true in more than one dimension. That
result is: a continuous function on a closed bounded set must attain
its maximum and its minimum. Here "bounded" means the whole set sits
inside some (perhaps very big!) ball. And "closed" means that all of
the limits of sequences in the set are in the set: the edges of
the set are included. Let me do an example.
|
Example on a square
Consider the polynomial f(x,y)=x2+y2+2+y and
let's try to find its max and min values on the square with sides
determined by x=±1 and y=±1. Inside the square, we can
look for peaks or pits by checking for critical points. So let's
consider:
fx=2x and fy=2y+1. The only critical point is
(0,–1/2). It would be difficult for f's value at (0,–1/2) (which is
1.75) to be both the max and the min of f on the square. But f can
have extreme values on the boundary of the square without these values
occurring at critical points.
The boundary of the square is fairly simple to investigate. For
example, one side has x=1 and –1≤y≤1. On that side
f(1,y)=12+y2+2+y=y2+y+3. Hey: the (1
dim) c.p. for this is at 2y+1=0 so y=–1/2. And the max/min for just
that side will be either at –1/2 or –1 or 1 (the last two values
of y are the endpoints of the interval, of course). Now
f(1,–1)=12+(–1)2+2–1=3 and
f(1,–1/2)=12+(–1/2)2+2–(1/2)=2.75 and
f(1,1)=12+12+2+1=5. Whew!
We could check the side with y=–1. Then –1≤x≤1 and
f(x,–1)=x2+(–1)2+2+(–1)=x2+2. There's
a (1 dim) c.p. at x=0, and the value at that point and the endpoints
should be considered: f(0,–1)=02+(–1)2+2+(–1)=2 and
f(–1,–1)=(–1)2+(–1)2+2+(–1)=3 and
f(1,–1)=12+(–1)2+2+(–1)=3.
I think I won't look at the other sides. The minimum value TURNS OUT
TO BE 1.75 and the maximum value, 5. A picture of the situation is
shown to the right.
I haven't told you the real problem: there are far more "closed and
bounded" objects than square or rectangles, and, not like the 1
dimensional case, the boundaries of the objects can be rather
complicated. Interior max and mins can be found by searching for
critical points, using the techniques we previously discussed. But
... for strange boundaries, ideas we haven't seen before are used. Let
me show you an example.
A rather simple example
Find the maximum and minimum values of 3x–4y+5z on the unit sphere
x2+y2+z2=1. Here is perhaps a more
complicated picture, with the constraint (the unit sphere) and five
planes representing where f(x,y,z)=3x–4y+5z=–8 and –3 and 1 and 5 and
9. The picture is supposed to help you understand that max/min occur
where the planes will be tangent to the sphere.
The system of Lagrange multiplier equations (three of them here, since
we are in R3) together with the constraint
follows. 2x=3(λ)
2y=–4(λ)
2z=5(λ)
x2+y2+z2=1
The left-hand sides are the components of ∇(x2+y2+z2)
and the right-hand sides are λ multiplying the components of
∇(3x–4y+5z).
You can solve for x and y and z in terms of λ, and
substitute these values in the constraint equation, getting
λ=±(2/sqrt(50)). Then 3x–4y+5z turns out to be (for the two
choices of λ, generating two candidates for where extreme values
take place) sqrt(50) and –sqrt(50). Here is a final picture of the
constraint and the two planes given by 3x–4y+5z=±sqrt(50).
|
|
Proofs, etc.: the dual (?) nature of math
I learned and "liked" Lagrange multipliers in a several variable
calculus course, just as I hope you might. The justification for the
method was more or less what I have shown you. So I knew it was
"true". But I never saw a "proof" of the Lagrange multiplier method
until my second year of grad school. Sigh. It really isn't that
difficult to prove. Maybe I didn't (even as an apprentice professional
mathematician!) feel the need to prove such a lovely idea.
|
A more complicated dimension 2 example
Find the point(s) on y=1/x2 which is(are) closest to the
origin and find the distance implied.
Here we are trying to minimize sqrt(x2+y2) when
(x,y) satisfies the constraint y–1/x2=0. I want to practice
using Lagrange multipliers (I acknowledge that other tricks can be
used).
So the objective function is sqrt(x2+y2): wait
-- I want to be a little bit nice to myself. Minimizing this function,
which is always non-negative is the same as minimizing its square.
This is an idea which is frequently very useful in practice (and it
also occurs, for example, in the workshop problem whose solution is to
be submitted tomorrow!): distance and energy and other "natura;"
quantities may have algebraic descriptions with square roots. The
minimum or the maximum of
a quantity described as SQRT(FROG) can be obtained by finding the max
or min of FROG itself, and then taking the square root. This is
because SQRT is a strictly increasing function. Getting rid of SQRT is
nice -- derivatives are easier, etc.
So
I will use x2+y2 as the objective function and
y–1/x2=0 as the constraint.
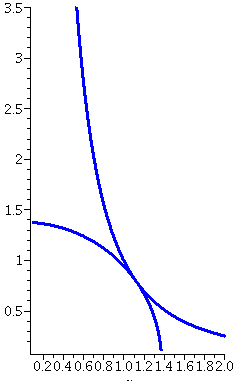 What are the Lagrange multiplier equations? The gradient of
x2+y2 is <2x,2y> and the gradient of
y–1/x2 is <2/x3,1> and therefore we have
the following "system" of three equations in three unknowns to solve:
What are the Lagrange multiplier equations? The gradient of
x2+y2 is <2x,2y> and the gradient of
y–1/x2 is <2/x3,1> and therefore we have
the following "system" of three equations in three unknowns to solve:
2x=(λ)(2/x3)
2y=(λ)(1)
y–1/x2=0
We can use the second equation to change the first to
2x=4y/x3 so that 2y=x4 (or
y=(1/2)x4). The third equation becomes
(1/2)x4–1/x2=0 and then
x=±21/6, while
y=(1/2)x4/6=2–1/3. The two points given by
this method are therefore
(±21/6,2–1/3). The distance
requested is sqrt(21/3+2–2/3). This exact
value probably can't be guessed!
The accompanying Maple graph shows a
parts of the graphs of y=1/x2 and
x2+y2=21/3+2–2/3 in the
first quadrant. They are tangent, as the previous discussion
suggests.
A heated spherical object (?!)
As a last example I considered the following problem: suppose a solid
object occupies the space specified by
x2+y2+z2≤1. Suppose at the point
(x,y,z), the temperature of the object is given by
T(x,y,z)=xy2z3 (I am not asserting that
this is a physically realistic problem!). What are the maximum and
minimum temperatures in the object?
Well, the max/min are either inside the ball or on the surface. let me
analyze these separately.
Inside the ball
If the max/min occur inside the ball, then they must happen at
critical points. Well,
∇T=<y2z3,2xyz3,3xy2z2>.
For which x, y, and z are all of the components equal to 0?
This seems almost silly. Look at the first component: if
y2z3=0 then either y or z must be 0. But if one
of y or z is 0, then the temperature,
xy2z3, must be 0. This is rather annoying: there
are many, many critical points, but none of them are maxes or
mins because the temperature can easily be positive or negative!
On the surface of the ball
So we need to find the max/min of T(x,y,z) subject to the constraint
of being on the surface of the ball:
f(x,y,z)=x2+y2+z2=1. Well, we've got
the vector equation λ∇T=∇f. This works out to the
...
QotD
One vector equation is here three scalar equations. We also need the
constraint. So we have:
(1)  λy2z3=2x
(2)  λ2xyz3=2y
(3)  λ3xy2z2=2z
(4)  x2+y2+z2=1
Solving the Lagrange multiplier equations
This collection of equations is sufficiently complicated that I've got
to think for a while. Note first that all of x and y and z should be
not equal to 0 since that would make T=0 and we covered that
when we did the interior critical point analysis. This means I can
divide without thinking too much (λ also can't be 0 because
then that would force one of the x, y, and z to be 0).
Divide equation (1) by equation (2). The result is y/(2x)=x/y so that
y2=2x2. Divide equation (1) by equation (3) and
the result is z/(3x)=x/z so that z2=3x2. These
two equations allow me to plug into (4), the constraint equation, and
the equation x2+y2+z2=1 becomes
6x2=1 so x=±1/sqrt(6). The signs of x and y and z
are not connected since they are related by (THING)2=(OTHER THING)2. Thus
y=±sqrt(2)/sqrt(6) and z=±sqrt(3)/sqrt(6). There are
EIGHT candidate points on the
boundary corresponding to all the possible sign choices of the
coordinates. The product of the signs determines whether one of the 8
points gives a max (there are four of those, and the sign product is
positive, and the value of temperature is sqrt(3)/36) or gives a min
(where the sign product is nagative, at four points where the
temperature is –sqrt(3)/36).
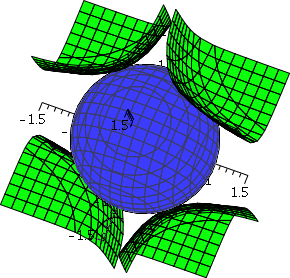
To the right is a picture of the sphere,
x2+y2+z2=1, in blue. That should be
easy to recognize. In green is a portion of the level surface,
T(x,y,z)=xy2z3=sqrt(3)/36. That's a sort of
strange surface. It seems to have 4 pieces, and the pieces are all
tangent to the sphere, exactly as the Lagrange multiplier method
predicts. But the picture is complicated.
Things are intricate. Higher dimensional problems may have lots of
special points to consider.
|
Return of the exam
I returned the exam. Here is a discussion of
the grades and grading. Please check your exam grading (and
arithmetic!) with the partial credit guidelines before any discussion
with me. I remark, as I did in class, that the letter grades are only
a guideline for students. To me, there is not much difference between
54 and 55, even though the letter assignments are distinct. I had sent
the following message to students who got D's or F's on the first
exam, and students with low C's should also read and think about the
message.
The first exam has been graded. This message is going to students who
got D's or F's on that exam. The exam was graded too late for me to
use the official university warning system. I want to signal these
students that their chance of success in the course is low.
I certainly can't address particular situations but something should
be done to learn more and better, because what you are doing so far is
not working. Please decide if what I write applies to you. You may
also wish to discuss your particular situation with either of the
recitation instructors or with me.
1. You should reconsider your time allocation. Perhaps decrease the
time you spend working on jobs or in organized extracurricular
activities. Reconsider how you spend your study time: plan seriously
to increase the efficiency and usefulness of this time.
2. Consider your overall academic load for the semester. Students who
do very poorly in this course's first exam rarely finish with a grade
of C or better. A grade of D doesn't guarantee you know very much,
even enough to use the ideas and methods of the course in applications
as many of you will need. You may want to drop this course or another
course. Withdrawal with a W is possible before October 27. If you
can't do what's in the previous paragraph, consider dropping this
course. That might be the more mature action.
I hope this message is useful. Exams should be returned at the end of
class Tuesday.
Sincerely,
S. Greenfield
Thursday, October 14, sections
12-14, and Friday, October 15, sections 15-17, lecture #13
Exams
I hope the first exams will be returned at the next meeting on
Tuesday, October 19.
Workshops
I tried to indicate some of my reasons for asking
students to do "workshop" problems, including working in small groups
and then writing up responses. This is all related to useful acdademic
and vocational skills, and I know this by direct evidience. The
probability that I will read your solution is about one-third
so please try to do a good job. Thank you.
Second derivative test for two variables
Suppose f(x,y) is a differentiable function, and
(x0,y0) is a critical point. That is,
fx(x0,y0)=0 and
fy(x0,y0)=0. Then compute
D=fxx(x0,y0)fyy(x0,y0)
–(fxy(x0,y0))2. Here we go:
| If D>0 |
and if
fxx(x0,y0)>0 then f has a local minimum at
(x0,y0). |
and if
fxx(x0,y0)<0 then f has a local maximum at
(x0,y0). |
| If D<0 then
f has a saddle point at
(x0,y0). |
| If D=0 then
this second derivative test supplies no information.
|
Please note that when D>0, the signs of fxx and
fyy must agree (as I said in class, this is not
obvious!) so that you can check either of these numbers. The textbook
calls D the discriminant. It is also called the Hessian
in some places (for example, Maple
and Mathematica). Also
I mentioned that I think of D as the determinant of this:( fxx fxy )
( fyx fyy )
Looking at D this way turns out to lead
to second derivative tests in more than 2 variables.
Why is this "test" valid?
The test essentially results from computing the second
directional derivative at the critical point and seeing how to ensure
that this result is always positive (or always negative or ...). That
together with results from one variable calculus (on concavity) will
insure some kinds of local behavior near the critical point. The
textbook has such a discussion. Another
way of understanding and verifying this result follows from a
two-dimensional version of Taylor's Theorem. Taylor's Theorem also
allows extensions of this derivative "test" to more variables and
higher derivatives.
In this course, we concentrate on stating the result and then giving
some examples. That is enough of a task! I hope you saw the test in
your recitations Wednesday. First, let me give an example from a
textbook. A textbook example - YAWN ... - well, not just any
textbook (or even ours!) but from a different, slightly older,
textbook.
Euler's example
Leonhard Euler (1707–1783) was a great and very prolific
mathematician. He published Institutiones Calculi
Differentialis (In English, Methods of the Differential
Calculus) in 1755. It was an influential text, one of the
earliest calculus texts, and was the first source of criteria for
discovering local extrema of functions of several variables. In it
Euler investigated the following specific example:
V=x3+y2–3xy +(3/2)x. He asserted that V
has a minimum at both (1,3/2) and (1/2,3/4). Was Euler correct? (My
source for this information is A History of Mathematics by
Victor J. Katz, Harper Collins, 1993, p.517.)
Let's compute. Vx=3x2–3y+{3/2} and
Vy=2y–3x. Critical points occur where both Vx
and Vy are 0. There 2y=3x or y= {3/2}x, so the
Vx condition becomes: 3x2–{9/2}x+{3/2}=0 or
6x2–9x+3=0 which factors (even then textbook problems were
predictable!) into (2x–1)(3x–3)=0. The critical points are as Euler
asserted: (1,{3/2}) and ({1/2},{3/4}). Logically just checking that
Euler's points are critical points is not enough -- we should
check that he found all critical points, which we did.
Now to test the type of the critical points: Vxx=6x,
Vxy=–3, Vyx=–3, and Vyy=2. So the
discriminant is the determinant of
(6x   –3)
(–3    2)
which is 12x–9. At (1,{3/2})
this is 12–9>0, and Vxx=6>0, so this
critical point is a local minimum. At ({1/2},{3/4}), the discriminant
becomes is 12·{1/2}–9=–3<0, which
makes this critical point a saddle point. Euler was wrong!
Two comments about what I did
- Solving non-linear equations can really be quite difficult,
and each collection of such equations can present different
"challenges". Any method that gets a solution is a good method, and
there's likely to be more than one good method!
- Since I sometimes make mistakes computing derivatives, I usually
compute both the xy and the yx derivatives and quickly see that
they're equal. This provides a small check in this computation.
Two more functions
Here are two amazing and disconcerting examples. At least, to me
these examples are both amazing ("surprise greatly; overwhelm with
wonder" -- well, at least the first) and disconcerting ("disturb the
composure of; agitate; fluster" -- certainly they show me I don't
understand too well what can happen in "space"). The results show some
huge differences between 1 and 2 dimensions.
One strange example
The function
f(x,y)=–(x2–1)2–(x2y–x–1)2
is given. This is not the world's most horrible function. It is "only"
a polynomial of degree 6. Let me find the critical points.
Well,
fx=–2(x2–1)2x–2(x2y–x–1)(2xy–1) and
fy=–2(x2y–x–1)x2.
Consider the equation fy=0 first. Well, maybe x=0. Then
fy=0 and fx=0–2(–1)(–1) is not 0. So this
doesn't get me any critical points.
Now to get fy=0 we can ask that x2y–x–1=0. Then
fx=0 becomes (x2–1)2x=0 since the other piece
becomes 0. Then either x=0 or x=1 or x=–1. Whew! If x=0,
x2y–x–1=0 becomes –1=0: false. If x=1, x2y–x–1=0
becomes y–2=0 so y=2. Therefore (1,2) is a critical point. If x=–1,
x2y–x–1=0 becomes y=0, and (–1,0) is a critical point.
If you don't like this logical torture, try the following:
> f:=-(x^2-1)^2-(x^2*y-x-1)^2;
                               2     2     2           2
                       f := -(x  - 1)  - (x  y - x - 1)
> solve({diff(f,x),diff(f,y)});
                        {x = 1, y = 2}, {x = -1, y = 0}
Yup, two critical points. Below are two very local pictures of
the graphs near the critical points.
The pictures certainly shouldn't be convincing evidence, but they do
seem to support the assertion that the function has local maximums
at both critical points!
Let me try the second derivative at, say, (–1,0). Sometimes
computations are good for the soul (sometimes?).
fx=–2(x2–1)2x–2(x2y–x–1)(2xy–1)
so
fxx=–2(2x)(2x)–2(x2–1)2–2(2xy–1)(2xy–1)–2(x2y–x–1)(2y)
and
fxy=–2(x2)(2xy–1)–2(x2y–x–1)(2x).
fy=–2(x2y–x–1)x2 so
fyx=–2(2xy–1)x2–2(x2y–x–1)2x
and
fyy=–2(x2)x2.
At (–1,0):
fxx=–2(–2)(–2)–2((–1)2–1)2–2(–1)(–1)=–10
fxy=–2((–1)2)(–1)–2(–(–1)–1)(2(–1))=2
fyx=–2(–1)(–1)2–2(–(–1)–1)2(–1)=2
fyy=–2((–1)2)(–1)2=–2
So D=(–10)(–2)–2(2)=16>0 and fxx<0: this is a local
max.
The other critical point also is a local max. I am getting too tired
to try this one. As I mentioned in class, I needed three tries to do
the first one correctly when preparing this example by myself!
Why do I find this disconcerting? Well, imagine we walk from one peak
to another (shown to the right, the blue "trail"). Shouldn't we
somehow pass through a saddle? Well, in fact, no, we don't need to:
maybe the lowest point on the blue trail is not a critical point --
the tangent plane to the surface at that point may be tilted. In this
example, the tangent plane is always tilted at every point
except the two peaks.
I tried to generate a good Maple graph
of f, but everything I tried didn't help me visualize things better.
Maybe someone else can come up with a good picture.
The situation in 1 variable calculus is considerably different.
If I
have two local maxes (and, yeah, if the function is continuous,
differentiable, etc.: nice) then there must be a local min between
them.
|
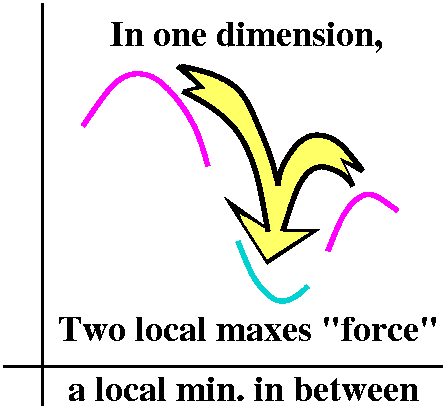
|
Another strange example
Here f(x,y)=3xey–x3–e3y. Then we
compute fx=3ey–3x2 and
fy=3xey–3e3y. If fy=0,
then ey3(x–e2y)=0 so x=e2y (the other
factor, ey, is a value of the exponential function and is
never 0). Then fx=3ey–3x2=0 leads to
3ey–3(e2y)2=0 or
ey–e4y=0 or
ey(1–e3y)=0. Since exp is never 0, we need
1=e3y and this occurs only when y=0. Therefore this
function has only one critical point, at (1,0).
My friend does this, by the way:
> f:=3*x*exp(y)-x^3-exp(3*y);
                                           3
                        f := 3 x exp(y) - x  - exp(3 y)
> solve({diff(f,x),diff(f,y)});
                               2                                 2
 {x = 1, y = 0}, {x = RootOf(_Z  + _Z + 1), y = ln(-1 - RootOf(_Z  + _Z + 1))}
Since I know that z2+z+1 has no real roots (what's under
the square root in the quadratic formula is
12–4·1·1=–3<0) this function
has exactly one critical point. And the formula for the function isn't
really that horrible, either.
The left graph below is a local picture of the critical point. This
seems to convincingly support the assertion that (1,0) is a
local strict maximum of the function. But I'll compute.
Since fx=3ey–3x2 then
fxx=–6x and fxy=3ey;
Since fy=3xey–3e3y then
fyx=3ey and
fyy=3xey–9e3y.
We evaluate and need the determinant of
( –6  3 )
( 3  3–9)
and this is positive. With fxx<0 at the critical point,
we conclude we have a local max.
In the graph on the right, x goes from –5 to 5 and y varies just
between –.05 and .05: therefore y is just about 0, and
3xey–x3–e3y is just about
3x–x3–1. Certainly this shows that the function
has no absolute max or min.
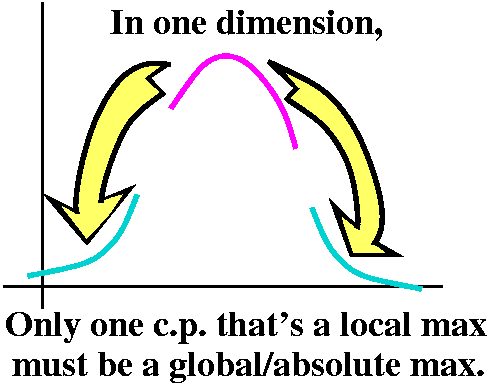 The situation in 1 variable calculus is considerably different.
Suppose we have a function defined on all of the real numbers (o.k., a
differentiable function) which has exactly one critical point
and that critical point is a local maximum. Then that local
maximum is a global, absolute maximum for the function. What the
heck is happening in several variables? I just don't
understand, that is, really understand beyond superficially. |
Consider the ellipse x2+5y2=1. Find the
rectangle of largest area inscribed in this ellipse with sides
parallel to the coordinate axes. Of course this turns into: maximize
4xy (the objective function) subject to
x2+5y2=1 (the constraint). Consideration
of the geometry (varying rectangles) suggests that there is indeed a
"biggest" rectangle, somewhere.
How the "heck" does a calc 1 student solve this problem since the
function to be maximized, 4xy, has two variables? Here are two
methods.
- Reduction of dimension, simple version
This is probably the orthodox way for students in CALC 1 to
solve the problem.
Since
x2+5y2=1, we know that
y=sqrt((1–x2)/5). Then the area is
F(x)=4x·sqrt((1–x2)/5). The domain for this function is
0≤x≤1. General theory from one variable calculus states that
max/min are obtained at end points or critical points. But
F(0)=F(1)=1. So the max is gotten where F'(x)=0. We computed this.
Of course, in a random situation, it may be very difficult to
solve (effectively!) for one of the variables in terms of the other.
- Reduction of dimension by parameterization
In calc 2 students might be aware of parameterization of the
curve. This is another way to "lower dimension".
We could make an inspired "guess": try x=cos(θ) and
y=sin(θ)/sqrt(5). Then the pair (x,y) is on the ellipse, and
since the max is obtained somewhere in the first quadrant, we are left
with maximizing
4xy=(4/sqrt(5))cos(θ)sin(θ)=(2/sqrt(5))sin(2θ) for
θ between 0 and Π/2. This can be solved almost "by
inspection": just take θ to be Π/4. The max value is then
4/sqrt(5). Of course, in a "random" situation it may be very
difficult to get nice parameterizations.
|
A weird 2-dimensional way to do the problem
I had Maple sketch some level curves of
4xy, the objective function, and compare them with the constraint
curve x2+5y2=1. Here is the result of these
Maple commands. A:=contourplot(x*y,x=-1.1..1.1,y=-1.1..1.1,color=red,
thickness=2,scaling=constrained,grid=[50,50],
contours=[.02,.05,.08,.2,.3,.5,-.02,-.05,-.08,-.2,-.3,-.5]):
B:=implicitplot(x^2+5*y^2=1, x=-4..4,y=-4..4,color=blue, thickness=2,
scaling=constrained, grid=[80,80]): display({A,B});
The picture is shown to the right. |
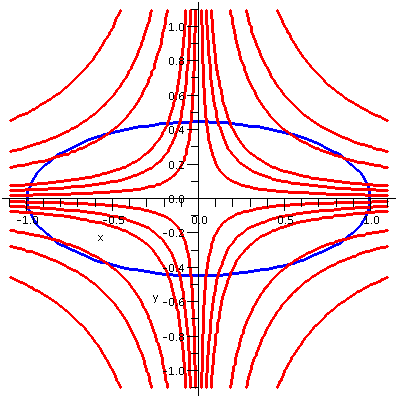 |
A close-up view
Suppose you consider a level curve of the objective function that
crosses the constraint curve, as shown. One math word which
applies to this situation is that the two curves are
transversal. So we have 4xy=C crossing
x2+5y2=1. What happens if we "wiggle" C a
little bit, so we consider 4xy=C+ε and 4xy=C–ε
(here ε is supposed to be a very small number). Now it seems
reasonable (4xy is certainly continuous, so its values don't hop
around or break or anything) that these level curves are close to
4xy=C. These level curves must also cross the constraint
curve. That means the function 4xy has values C+ε and
C–ε on the constraint curve. (The level curves are
exactly where that function takes on its values!) Since there are both
larger and smaller values of 4xy on the constraint curve, C can't be
an extreme value (either max or min) for 4xy on
x2+5y2=1.
|
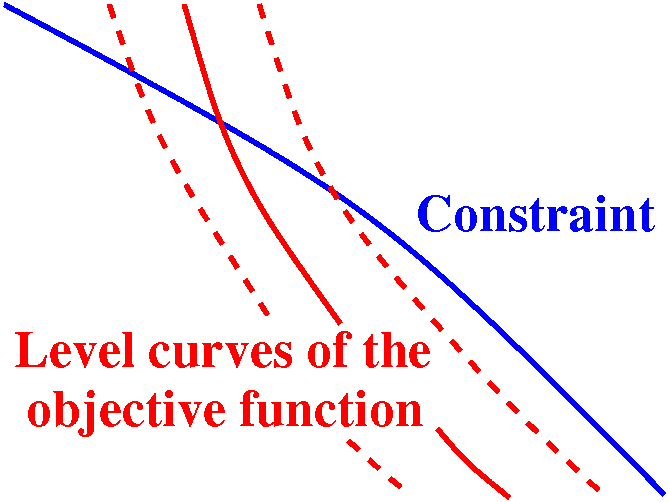
Local picture near a level curve
corresponding to a non-extreme value |
Another close-up view
This seems to imply, if you examine the picture closely, that the
largest (and the smallest) values of 4xy will be at points on the
ellipse where the ellipse will be tangent to level curves of the
constraint, x2+5y2=1. If the level curves of the
objective function are not tangent, then we will be able to vary the
values of the constant generating that contour and get bigger and
smaller values of the objective function on the constraint curve.
If the level curves are tangent then the normal vectors of the
constraint curve (∇f at that point) and the objective function
(∇g) at that point will both be perpendicular to the same line (in
three dimensions it would be a tangent plane). These gradient
vectors may not be exactly the same vector, but one of them must be a
scalar multiple of the other.
|
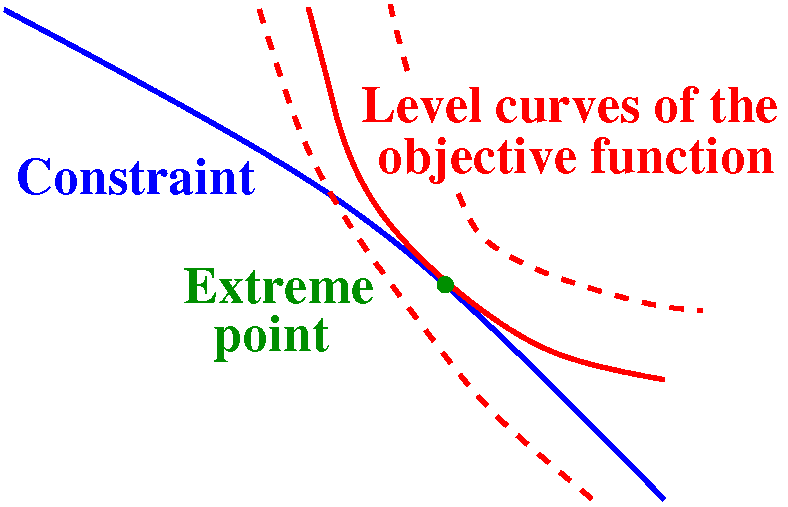
Local picture near a level curve
corresponding to an extreme value |
Now the algebraic side
If f(x,y)=4xy and g(x,y)=x2+5y2=1, then at such
points (extreme values of the objective function on the constraint
curve), there is some real number
λ so that ∇g=λ
∇f (everyone uses this Greek letter) because the tangent
lines are the same, and therefore the normal vectors must be parallel:
one must be a scalar multiple of the other. This one vector equation
in R2 gives two scalar equations, one for each component of
the vectors:2x=(λ)4y
10y=(λ)4x
This, together
with the constraint equation g(x,y)=x2+5y2=1
gives a system of 3 equations in 3 unknowns. We can solve this by, for
example, solving for λ in each
of the first two equations and setting them equal. We need to watch
out for spurious solutions or evasions of solutions. These may occur
when we divide by certain variables. This gave us another way to solve
the maximization problem, a method which is more in the spirit of
several variable calculus. It turns out that this strange idea is
actually quite useful in "real world" problems. The method is called
Lagrange multipliers
and is discussed in section 14.8 of the text. The
method is used extensively in economics and in many areas of
engineering.
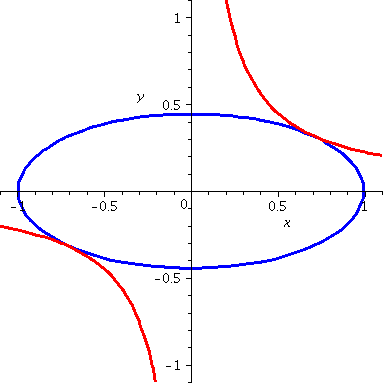
Here is a detailed solution of the system of equations. The first and second
equations tell me that λ=2x/4y=x/2y and λ=10y/4x=5y/2x
so that x/2y=5y/2x and 2x2=10y2 and therefore
x2=5y2. Now combine this with the constraint
equation,
x2+5y2=1. We see that 2x2 must be 1,
so that x should be ±1/sqrt{2} and y=±1/sqrt{10}. For
the maximum value of 4xy, take either both plus signs or both minus
signs. Then 4xy will be 4/sqrt{20}=2/sqrt{5}.
To the right is the ellipse, the constraint, and a level curve of the
objective function for the supposed maximum value: so it is
4xy=2/sqrt{5}. And, just as predicted, these curves are tangent.
Fan mail for the Lagrange multiplier method
I think it is wonderful that a relatively small amount of
algebraic effort can produce such a lovely geometric result (the
specific hyperbola which is tangent to the ellipse). This reassures
me that things algebraic and geometric both reflect the same
reality.
Tuesday, October 12, sections
12-14 and sections 15-17, lecture #12
We had an exam.
Thursday, October 7, sections
12-14, and Friday, October 8, sections 15-17, lecture #11
Here is the remainder of this lecture dealing with "new" material, and
discusses ideas which won't be covered on the first exam.
Review sessions for the first
exam
All students in all sessions are welcome at either or both review
sessions.
- On Sunday, October 10, Mr. Vidit Nanda will have a review session from
from 3:00 PM to 4:30 PM in SEC 202 (on Busch Campus)
- On Monday, October 11, Mr. Gabe Bouch will have a review session from
from 7:00 PM to 9:00 PM in LSH B269 (on Livingston -- nothing was
available on Busch)
I thank both of these gentlemen sincerely.
Next in the course is an introduction to max/min in several
variables.
Review of 1 variable
I try not to work hard, so I thought maybe a quick review of extreme
value material from 1 variable calculus would be useful. The names of
ideas to recall include these:
critical point, maximum, minimum, absolute maximum, absolute minimum,
local maximum, local minimum.
Fermat's fact
What I called "Fermat's fact" was the following wonderful observation
in one-variable calculus:
If f is differentiable at x0
and if f´(x0) is not 0, then f does not have an
extreme value at x0.
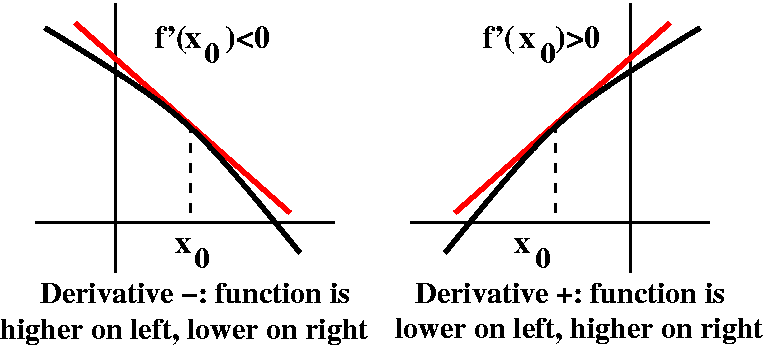
The picture shows a "proof" (well, I hope fairly convincing to a
picture person). If there is a tilt in the tangent line, then there
are both higher and lower values near x0. If x0
is either kind of extreme value (max/min), then we see that
f´(x0) cannot be 0.
Critical number
Therefore the following definition was created.
x0 is a critical point of the function f
if either f is not differentiable at x0 or
f´(x0)=0.
For simplicity in this discussion I'll assume that f is defined in
some interval that has x0 inside it (in the interior). Here
are some pictures of critical points in 1 variable.
What the zoo shows in the first two pictures are functions which are
not differentiable at a point. The first such does not have an
extreme value, but the second has a local min. Such nondifferentiable
behavior occurs frequently in a number of applications. It is just
considered bad taste to show pictures like this in calc 1 but really
there are areas of applications (industrial engineering, operations
research) where such pictures are typical, not exceptional. The
other pictures are differentiable at the critical point. At the first
picture (locally like x3, say), the function doesn't have
an extreme value (max or min). At the other two, there is a local min
and a local max, respectively.
Identifying ("classifying") the type of critical point
Taylor's Theorem sort of helps us understand the 1 variable case, at
least where the point is "critical" because the derivative is 0. Here
we have
f(x)=f(x0)+f´(x0)(x–x0)+f´´(x0)/2(x–x0)2+H.O.T.
where the H.O.T.'s are at least 3rd order, and
→0 faster than the other terms. If the first derivative is 0 at
x0, this becomes
f(x)=(Value at x0)+0+(Some number)(x–x0)2+H.O.T.
The second derivative test in one variable is the recognition that if
Some number is positive then
locally the graph of the function looks like a parabola opening up, so
the function must have a local min. If Some number is negative the
parabola opens down, and the function must have a local max. If Some number is actually 0, then the
H.O.T.'s get involved, and the situation can't be deduced from
the second derivative: not enough information. Examples supplied by
students (x3 and x4 and –x4)
showed that if f´(x0)=0 and also
f´´(x0)=0 then the function could have no local
max/min and a local min or a local max at x0. Things are
complicated.
And now let's look at more than 1 dimension: maximum, minimum,
absolute maximum, absolute minimum, local maximum, local
minimum. These words and phrases mean more or less then same, but
max/min in more than one variable is much more
complicated. Some examples will be useful. We deal now with f(x,y).
(x0,y0) is a local minimum of f if
f((x0,y0)≤f(x,y) for (x,y)'s close to
(x0,y0).
(x0,y0) is a local maximum of f if
f((x0,y0)≥f(x,y) for (x,y)'s close to
(x0,y0).
If instead of local we want absolute then "close to"
gets exchanged for "all (x,y) in the domain of f". If we want
strict local max or strict local min then we should ask
that ≤ becomes < for (x,y)'s not equal to
(x0,y0). There's a similar modification for
strict local min. (The peak of a mountain is usually a strict
local max, while a ridgeline in the hills may not be strict -- other
points may have equal height.
(x0,y0) is a critical point of f if
either at least one of ∂f/∂x(x0,y0)
or ∂f/∂y(x0,y0) does not exist
OR
∂f/∂x(x0,y0)=0 and
∂f/∂y(x0,y0)=0.
The simple pictures with simple formulas
Here are some pictures and some formulas.
| Discussion and formulas | The pictures |
|---|
A cone
I wanted to give an example of a function which
might make you think a bit. Consider
f(x,y)=sqrt(x2+y2). The contour curves (z=constant) are all circles centered at the
origin because they are x2+y2= constant2. But a "trace" with y=0
in the xz-plane has z=sqrt(x2). This is not a straight line (square root is a function with
domain non-negative reals and range also non-negative reals!). It is
z=|x|. So the circles pack themselves to come to a point at
(0,0,0). This is certainly a local min, and it is certainly also a
critical point but no partial derivatives exist at x=0 and y=0.
|
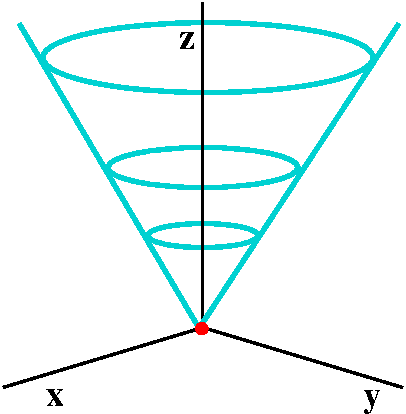
|
Min
A function defined on all of R2 with a local (and absolute)
minimum is f(x,y)=x2+y2. The graph of this
function is a surface called a paraboloid. It is a nice, smooth
"cup" opening up. Vertical slices through (0,0) are all parabolas
opening up and the contour lines are circles.
The red dot is the critical point and
the brown plane is the tangent plane
at that point (the xy-plane).
|
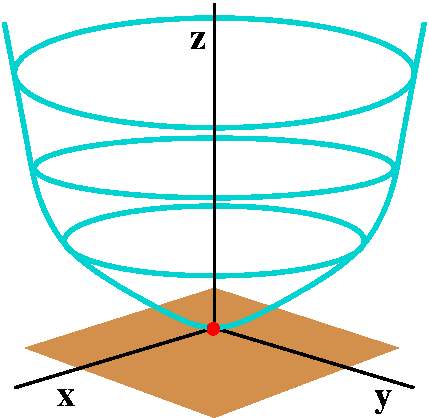
|
Min
The simplest local and absolute strict maximum is, of course, just the
reflection of the previous example, done with minus signs
algebraically. So here f(x,y)=–x2–y2, and (0,0)
provides a strict maximum. The graph is a paraboloid whose axis of
symmetry is again the z-axis. This graph opens "down".
|
|
A saddle
The function f(x,y)=–x2+y2 gives a nice example
of a saddle point. The xz-slice (where y=0) shows the curve
z=–x2 and the yz-slice (where x=0) shows
z=y2. Each has a (strict) extreme point at 0. One is a max
and one is a min. Such behavior is called a saddle
point. Perhaps the behavior most similar in one variable calculus
would be that of the function x3 (an inflection point). But
in 2 and more variables the local picture can be much more
complicated.
Here the surface is more complicated, and my picture is certainly not
so good. But the tangent plane and critical point are the same. The
tangent plane cuts through the surface (similar to the way a tangent
line at an inflection point in 1 variable calculus cuts through the
graph of a curve).
|
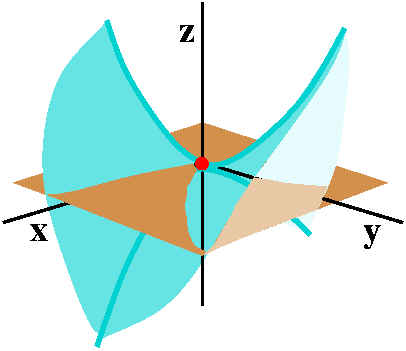
|
Using Fermat's fact here
If a point is a local extreme point of some function f in several
variables, and if that function is differentiable at that
point, then all of the first partial derivatives of the function must
be 0 at that point. If that's not true, just "slice" the function at
that point in the direction of the derivative which is not 0. The one
variable Fermat fact implies that the function does not have an
extreme value (max or min) at the point in one variable, and therefore
the function in several variables has both higher and lower values
near the point. Therefore (whew!):
An extreme point
must be a critical point.
Our functions will almost always be differentiable (not like the graph
of the cone above), so our functions will have their extreme values
where ∇f=0. This doesn't mean that non-differentiable functions
(functions with jumps or corners) are not important or interesting in
mathematics and its applications (again: linear optimization which is
a major tool in some areas of industrial engineering, shock waves in
physical phenomena). Just learning to use the tools for higher
dimensional analysis of differentiable functions is a big enough task.
Another instructor's final exam question
Suppose
f(x,y,z,w)=3x6+8y12+55z8+9w64.
What are the critical points of f and what type (max, min, saddle) are
they?
This problem seems a bit forbidding. But
fx=3·6x5. The only way this is 0 is for x
to be 0. Similar remarks for fy, fz, and
fw imply that the only critical point for this function is
(0,0,0,0).
What type of critical point is (0,0,0,0)? Well, f(0,0,0,0)=0. And if
any of the coordinates in (x,y,z,w) is not 0, then (since we have only
even powers!) f(x,y,z,w)>0. Therefore this critical point is an
absolute minimum.
|
Suppose z=f(x,y), and f is differentiable. What is the geometric
meaning of "(x0,y0) is a critical point of f"?
Since ∇f(x0,y0)=0, both of the first partial
derivatives are 0. Therefore z=f(x0,y0) (that
is, z=a constant) is the tangent plane to z=f(x,y) at the point
(x0,y0,f(x0,y0)). The
"flat" plane through the point, parallel to the xy-coordinate plane,
is tangent to the surface. This can be difficult to "see" in a graph,
though.
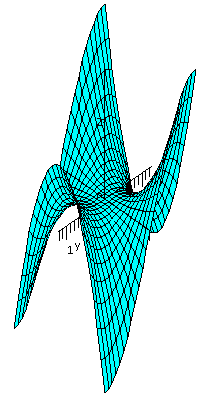 Monkey saddle
The examples already shown are the standard critical points for
functions of two variables. But there are other kinds of critical
points. The graph z=x3–3xy2 shows one of
them. Again the origin, (0,0), is the only critical point. This is
because zx=3x2–3y2 and
zy=–6xy. For zy to be equal to 0, either x
or y must be 0. But then use zx=0 to conclude that the
other variable must be 0 also. For this function, the xy-plane is the
tangent plane at the origin because (0,0,0) is on the graph. This
critical point's local behavior is up/down repeated three times (at
equally spaced 120o angular intervals) if you walk around
the surface in a small circle centered at the origin. The critical
point is called a monkey saddle because, presumably, a monkey
could sit on it with spaces for two legs and a tail to hang
down.
Critical points in more than one variable can have very different
local pictures, and there has been a great deal of effort expended
trying to understand them.
Our next task will be to learn and use a two variable version of the
second derivative test,
Maintained by
greenfie@math.rutgers.edu and last modified 10/8/2010.
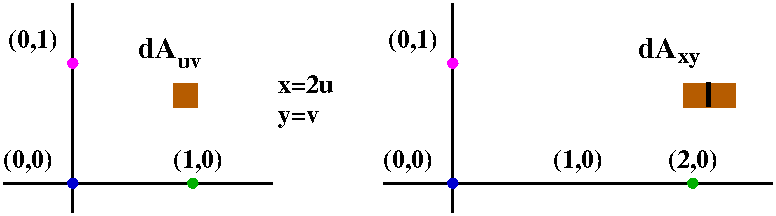 Suppose I have two copies of the plane, R2. The left-hand
copy in my pictures will have coordinates labeled with u and v and
will be called the uv plane, and the right-hand copy will have
coordinates labeled with x and y and will be called the xy plane.
In this example, x and y will be related to u and v using the
equations
Suppose I have two copies of the plane, R2. The left-hand
copy in my pictures will have coordinates labeled with u and v and
will be called the uv plane, and the right-hand copy will have
coordinates labeled with x and y and will be called the xy plane.
In this example, x and y will be related to u and v using the
equations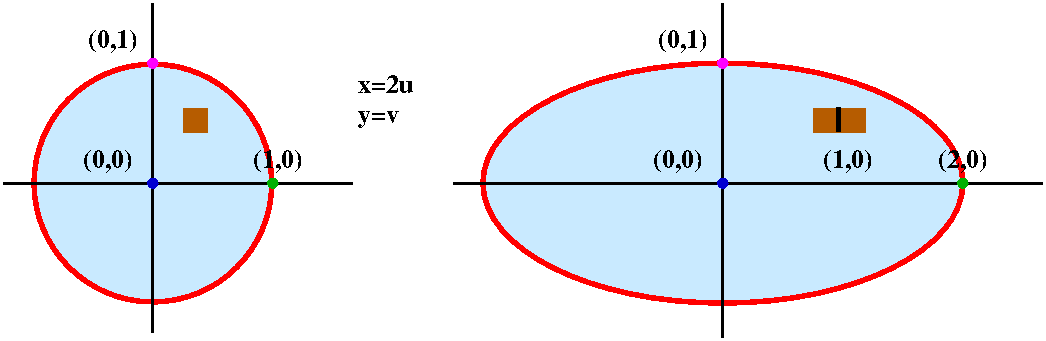 Now consider a more intricate shape in the uv plane, the unit circle
centered at the origin: u2+v2=1. What shape
corresponds to this circle in the xy plane? Well, since 2u=x, we know
u=x/2, and v=y, so that u2+v2=1 corresponds to
(x/2)2+y2=1.
Now consider a more intricate shape in the uv plane, the unit circle
centered at the origin: u2+v2=1. What shape
corresponds to this circle in the xy plane? Well, since 2u=x, we know
u=x/2, and v=y, so that u2+v2=1 corresponds to
(x/2)2+y2=1. 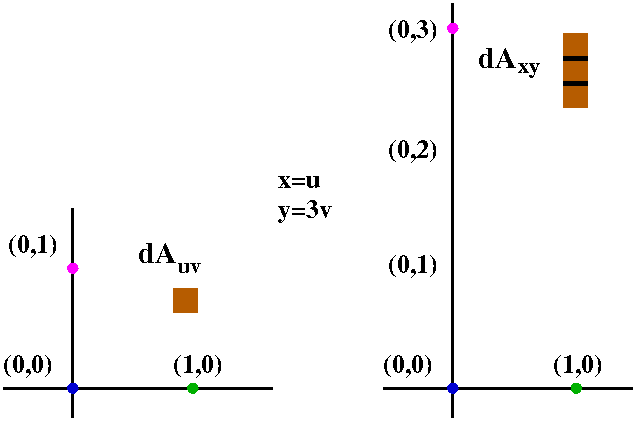 Here is a different relationship between two copies of the plane. In
this example, x and y will be related to u and v using the
equations
Here is a different relationship between two copies of the plane. In
this example, x and y will be related to u and v using the
equations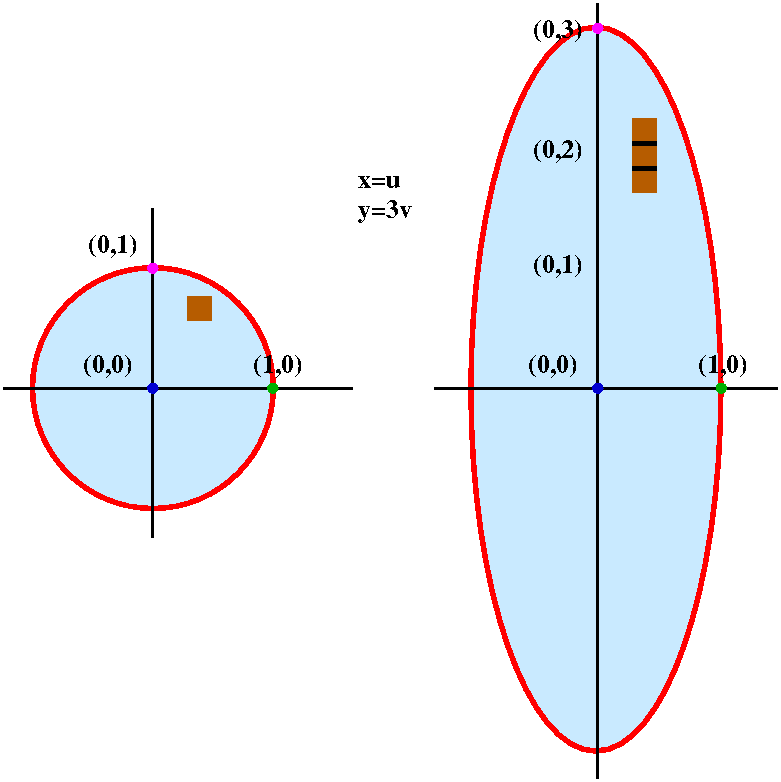
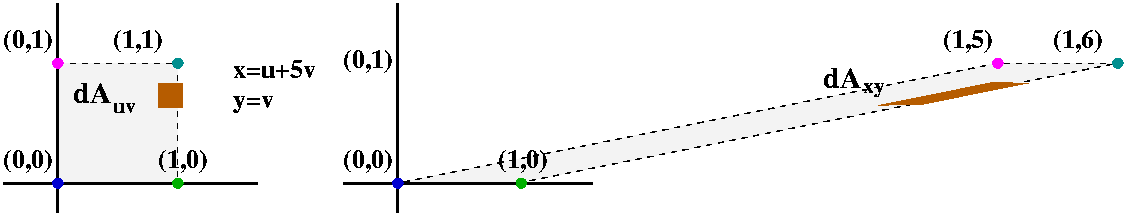 x=u+5v
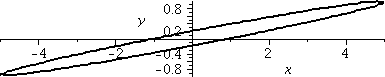
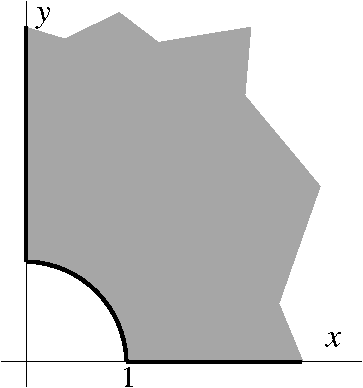 QotD
QotD The average temperature of a box of ocean