The last questions of the Maple "field trip" asked students about the surfaces which are the graphs z=x2+y2 and z=x3-xy2.
Here is how I answered the questions. It is unfortunate that the procedure is quite long and intricate, but I must admit that these questions demand a good deal of analysis in order to be certain that the answers are correct.
I used Maple to suggest the answers, and then used more standard mathematical procedures to verify the suggestions. The verfications are sometimes quite elaborate, but since Maple only samples finitely many points, some logical analysis is necessary to be sure.
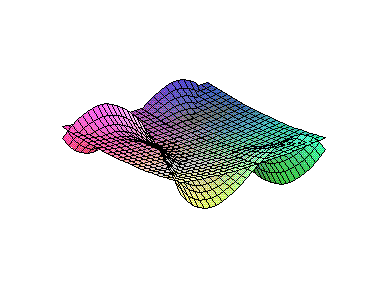
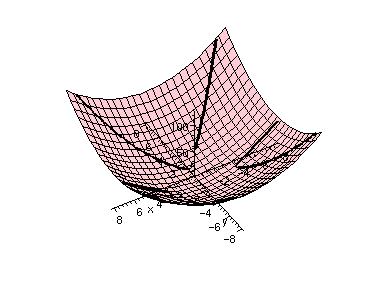
plot3d({x^2+y^2,x^3-x*y^2},x=-10..10,y=-10..10);
and got the following picture
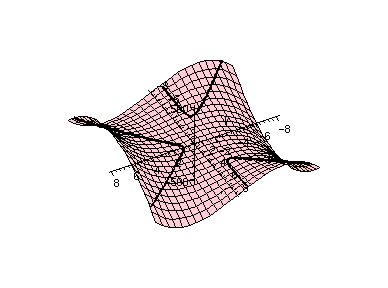
YELLOW:=plot3d(x^2+y^2,x=-10..10,y=-10..10,color=yellow,grid=[100,100]):
RED:=plot3d(x^3-x*y^2,x=-10..10,y=-10..10,color=red,grid=[100,100]):
Before the next instruction I typed with(plots); which loads a collection of programs for graphics. Maple has hundreds (certainly) and maybe thousands (probably!) of commands. Only the "basic" commands are loaded when the program is first invoked. In this case, we will want to use several less common plotting commands, so we must load the plots package. The result of
display3d({YELLOW,RED});
is shown:

implicitplot(x^2+y^2=x^3-x*y^2,x=-5..5,y=-5..5,grid=[100,100]);
In this picture, a version of the intersection curves is projected onto the (x,y)-plane (the z-coordinate is "forgotten").
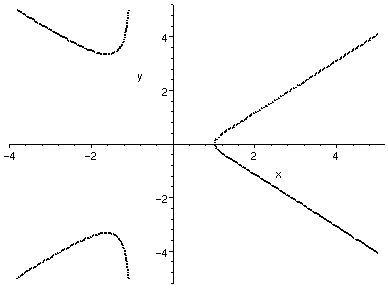
From this it appears that there are indeed three curves in the intersection.
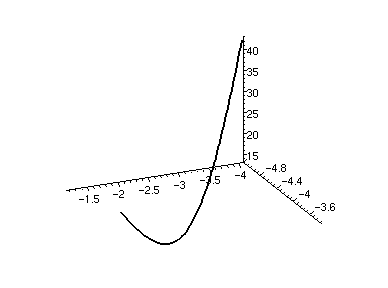
plot((x^2*((x-1)/(1+x))),x=-4..2,y=-10..15,thickness=2,color=black,labels=[`x`,`y^2`]);
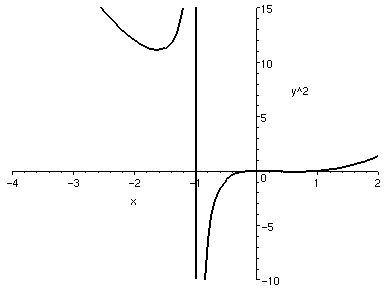
By the way, I use thickness=2 to get a slightly thicker curve which is easier to see. And, of course, I used color=black because the contrast with the white background is stronger.
I tried various versions of this instruction, including the following.
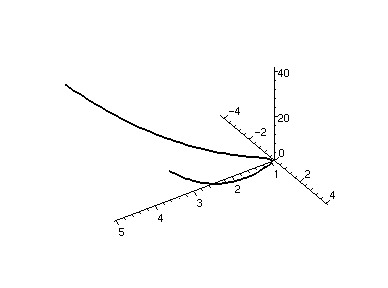
plot((x^2*((x-1)/(1+x))),x=-.5..2,thickness=2,color=black,labels=[`x`,`y^2`]);
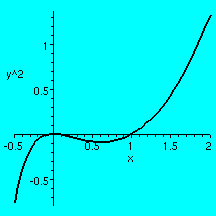
which was the first hint I had from Maple that there was something happening at the origin. None of the 3-dimensional plots had explicitly shown me an intersection there. Plotting is done by sampling and connecting the dots. I was not lucky enough to see something at (0,0,0).
Apparently there will be (x,y)'s satisfying (1+x)y2=x3-x2 for x's in the range x<-1 and x not equal to 1 and x=0. The pairs are (x,+/-x*sqrt((x-1)/(x+1)) when x is not equal to 0, and also the point (0,0). Note: sqrt(A) will mean the non-negative square root of the non-negative number, A. I'll refer to the parts away from the origin as "the curves" and discuss them in the next step. I'll verify my suspicions (?) about the origin in the last step.
Q:=t*sqrt((t-1)/(t+1));
spacecurve([t,Q,t^2+Q^2],t=-4..-1.2,axes=normal,color=black,thickness=2);
This is a static representation which really benefits by looking at a Maple picture interactively, and rotating it. One can also draw either (or both) of the surfaces with the space curve (I did this!) and verify that the curve is actually in both surfaces.
Of course there is another curve which can be gotten by changing the sign of the second coordinate.
Here is a display of the third curve (corresponding to x> 1).
PLUS:=spacecurve([t,Q,t^2+Q^2],t=1..5,axes=normal,color=black,thickness=2):
MINUS:=spacecurve([t,-Q,t^2+Q^2],t=1..5,axes=normal,color=black,thickness=2):
display3d(PLUS,MINUS);
Again the picture suffers because it is "static". Also, although this is a "smooth" curve (it has no corners -- we will call such a curve differentiable) the parameterization using x as "t"is flawed because of the square root in the second coordinate. We could in fact parameterize using y and get functions which appear smooth, but the details are complicated. The Maple instruction solve(y=x*sqrt((x-1)/(x+1)),x); shows you one possible answer.
Here is one view of three curve fragments in space on the cup z=x2+y2, and the other is the curve fragments on the surface z=x3-xy2.
Maintained by greenfie@math.rutgers.edu and last modified 8/21/2002.