One can probably do everything by "pure thought" and never look at a
graph or any algebra, but I am not that smart. If the function f(x) is
at all complicated and I want to see what
happens when using Newton's method with
different initial values, I usually look at a graph and almost always
do some sample computations. You can do most of what I do
below on a graphing calculator. These days I tend to use
Maple because the computer screen is larger than the screen
on a graphing calculator. I will investigate the "random"
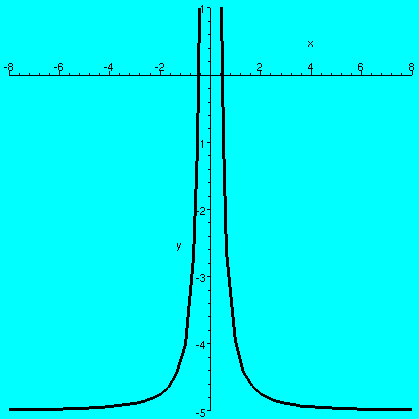
function f(x)=1/x2-5. I think that we can actually get the
roots of the equation f(x)=0 explicitly: 1/x2-5=0 when x=+/-sqrt(5)
(approximately +/-.44721).
Step 1
I would probably graph y=f(x). I
actually tried various windows before I looked at the graph for x
between -8 and 8 and y between -5 and 1. The picture to the right was
produced by Maple in response to the instruction
plot(1/x^2-5.,x=-8..8,y=-5..1,color=black,thickness=3); but
you don't need to use Maple. A graphing calculator will give
good results. Then I would look at the graph and try to make some
guesses about the behavior of Newton's method. I would pick a starting
point and slide down (or up!) the tangent line until it hit the
x-axis, and then repeat again and again in my mind until I got some
feeling about whether the iterates were converging to a root (which
root?) or doing something else.
Step 2
(I'm a picture sort of person. If I were an algebra sort of person,
this might have been step 1.) I would write f(x), and compute
f'(x), and put it all together in the Newton's method iteration:
x-[f(x)/f'(x)] and then simplify the iteration as much as possible. In the case of this f(x),
f'(x) is -2/x3, and then (after doing all the algebra) the
Newton's method iteration turns out to be
"replace x by 1.5x-2.5x3". I would write a short program on my graphing
calculator which would evaluate this, because I will want to
repeatedly evaluate this function on its own output.
Here are some Maple instructions:
| Instruction | Comments |
|---|---|
| h:=x->1.5*x-2.5*x^3; | This tells Maple to remember that h(x)=1.5x-2.5x3. You can write and store a short program for your Newton's method iteration on your calculator. |
| G:=x->seq((h@@n)(x),n=1..10); | This instruction is rather weird and specialized. It tells
Maple to make G(x) a function whose output is going to be a
sequence of repeated function compositions. The rather strange
@@ asks Maple to
repeatedly compose the function h with itself. So (h@@3)(.7)
will return h(h(h(.7))). G(x) will then return a sequence of 10
numbers: the first number will be h(x), the second number will be
h(h(x)), etc. You should be able to get the same effect as (h@@3)(.7) on your graphing calculator fairly easily if you have inserted the formula for h as a program. |
One the left is part of my Maple session after I defined the functions h and G as above. My input typing is after the Maple prompt (which is >) and ends with a semicolon (;). Maple's response follows. I wrote some comments on the right.
>h(.5);
                                0.4375
>G(.5);
  0.4375, 0.4468994140, 0.4472132645, 0.4472135956, 0.4472135955,

        0.4472135954, 0.4472135955, 0.4472135954, 0.4472135955,

        0.4472135954
>G(10.);
                          11                  33                 97
  -2485.0, 0.3836358157 10  , -0.1411553832 10  , 0.7031246842 10  ,

                        291                 874                  2621
        -0.8690345500 10   , 0.1640782962 10   , -0.1104316145 10    ,

                       7861                  23582
        0.3366822908 10    , -0.9541152318 10     ,

                       70747
        0.2171413312 10
|
So h(.5) is .4375 (this agrees with what it should be:
1.5(.5)-2.5(.5)3=.75-.3125=.4375
These G-values are the first 10 iterates of Newton's method, starting at .5: it seems that this starting point gives converges to the right-hand root. |
Step 3
I would think and go back through steps 1 and 2 where necessary. That
is, I would look at the graph and the algebra and begin to learn what
happens. For example:
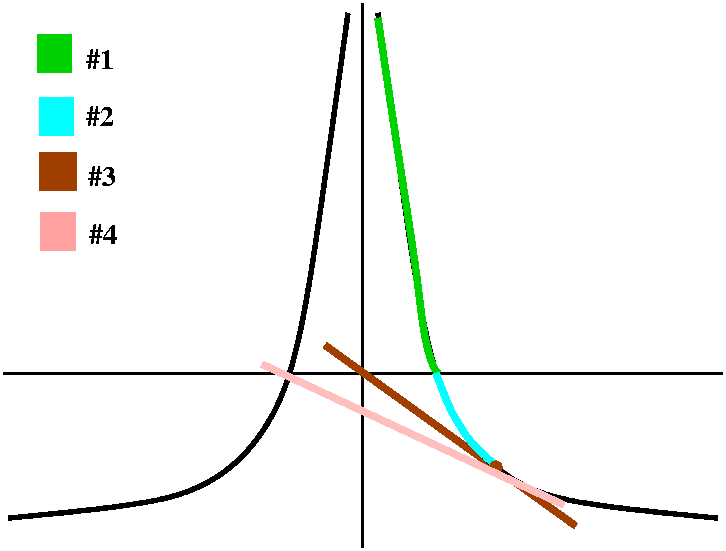
Some (but only some!) conclusions for this graph:
| #1 | This part of the graph seems immediately attracted to the root on the right. |
| #2 | This part of the graph seems to be taken into part #1 by a Newton iteration, so it too gets attracted to the right-hand root. |
| #3 | This point gets taken to the origin, so it is out of the game. |
Comment
The function I've asked you to analyze is a great deal simpler than
this one, and you should be able to get an idea of its behavior quite
easily, and then write, draw, compute, and explain your conclusions in a convincing
and logical manner.
Maintained by greenfie@math.rutgers.edu and last modified 10/24/2003.