Notes on Laplace transforms are now
available expressing the lecturer's preference in organizing
the formulas and using them to compute Laplace transforms and inverse
transforms. Examples of the main applications are also included.
Regular office hours can be found on the instructor's home page. Special office hours before
exams will be announced here. The discussion tool in the Sakai
site can also be used to send queries at any time.
Notes on Sturm-Liouville problems and applications to the
Separation of Variables method for partial differential
equations have been prepared. Since the solutions include solutions
to problems from the textbook, these notes are only available through
the Sakai site for the section.
Grades
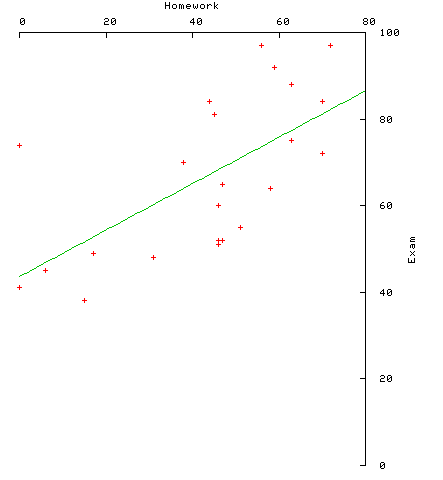 The first exam has
been graded. The average score was 66.7 and the median was 65. A
scatter plot shows the comparison of grades on this exam with the
homework score.
Individual grades have been entered in the FAS
Gradebook. There is also a distribution of scores (but no attempt
to assign letter grades) and scaled averages (formed by
dividing by the maximum possible score [or base score ] and
multiplying by 10) for each problem. Scaling allows easy comparison
of the difficulty of problems of different weight, since the maximum
score is always 10.
The first exam has
been graded. The average score was 66.7 and the median was 65. A
scatter plot shows the comparison of grades on this exam with the
homework score.
Individual grades have been entered in the FAS
Gradebook. There is also a distribution of scores (but no attempt
to assign letter grades) and scaled averages (formed by
dividing by the maximum possible score [or base score ] and
multiplying by 10) for each problem. Scaling allows easy comparison
of the difficulty of problems of different weight, since the maximum
score is always 10.
Exam 1
Distribution
| Range |
Count |
| 88 - 97 |
4 |
| 81 - 84 |
3 |
| 70 - 75 |
4 |
| 60 - 65 |
3 |
| 38 - 55 |
9 |
|
Problems
| Prob. # |
Scaled Avg. |
| 1 |
8.67 |
| 2 |
8.52 |
| 3 |
5.70 |
| 4 |
7.74 |
| 5 |
4.22 |
| 6 |
6.09 |
| 7 |
5.62 |
|
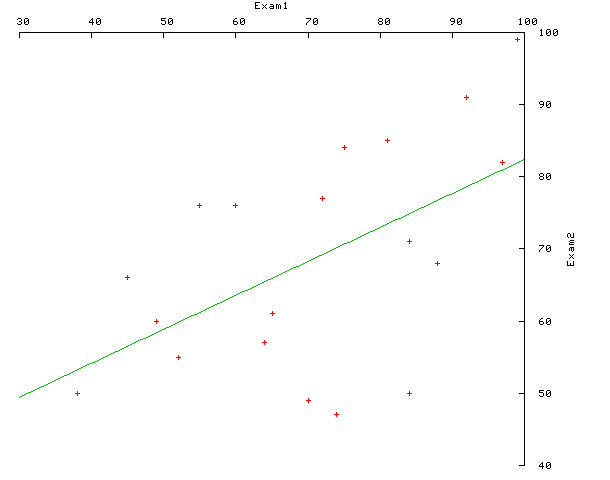 The second exam has
been graded. The average score was 68.7 and the median was 68. A
scatter plot shows the comparison of grades on this exam with the
homework score.
Individual grades have been entered in the FAS
Gradebook. There is also a distribution of scores (but no attempt
to assign letter grades) and scaled averages (formed by
dividing by the maximum possible score [or base score ] and
multiplying by 10) for each problem. Scaling allows easy comparison
of the difficulty of problems of different weight, since the maximum
score is always 10.
The second exam has
been graded. The average score was 68.7 and the median was 68. A
scatter plot shows the comparison of grades on this exam with the
homework score.
Individual grades have been entered in the FAS
Gradebook. There is also a distribution of scores (but no attempt
to assign letter grades) and scaled averages (formed by
dividing by the maximum possible score [or base score ] and
multiplying by 10) for each problem. Scaling allows easy comparison
of the difficulty of problems of different weight, since the maximum
score is always 10.
Exam 2
Distribution
| Range |
Count |
| 91 - 99 |
2 |
| 82 - 85 |
3 |
| 76 - 77 |
3 |
| 66 - 71 |
3 |
| 55 - 61 |
4 |
| 47 - 51 |
4 |
|
Problems
| Prob. # |
Scaled Avg. |
| 1 |
5.71 |
| 2 |
5.58 |
| 3 |
7.82 |
| 4 |
7.66 |
| 5 |
7.55 |
|
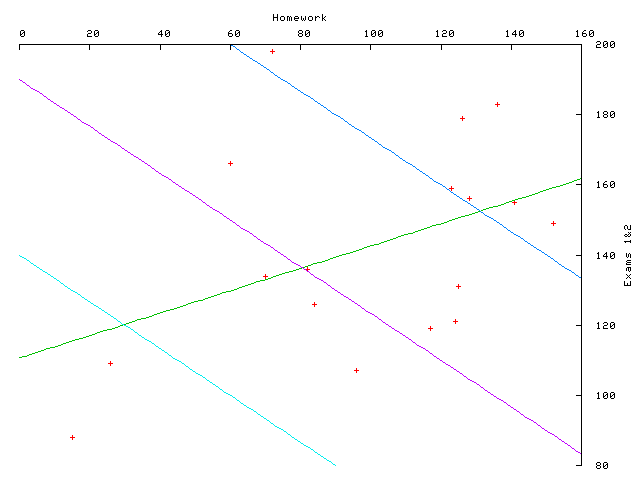 A plot of homework
as a predictor of midterm exams, including a tend line, was produced. This suggested that the
raw score of homework (actual maximum score 152 out of a possible
170), be multiplied by 2/3 before being combined with the exam
scores. Lines showing totals of 240, 190 and 150 were added to the plot.
The final exam has
been graded. The average score was 135.8 out of 200, with a median of 140.
A plot of homework
as a predictor of midterm exams, including a tend line, was produced. This suggested that the
raw score of homework (actual maximum score 152 out of a possible
170), be multiplied by 2/3 before being combined with the exam
scores. Lines showing totals of 240, 190 and 150 were added to the plot.
The final exam has
been graded. The average score was 135.8 out of 200, with a median of 140.
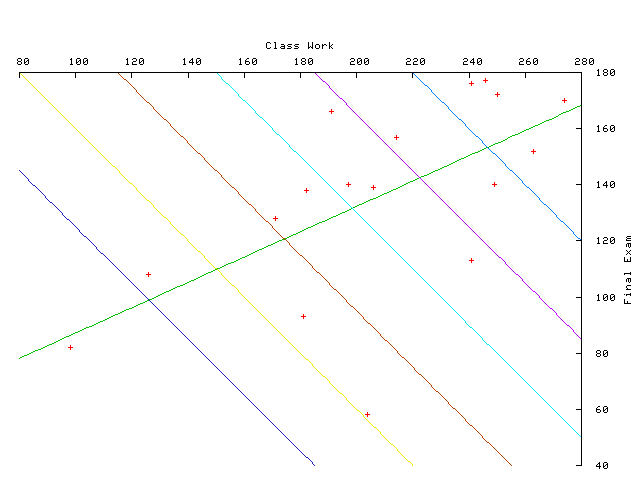 Another
scatter plot shows the comparison of grades on this exam with the
total classwork score.
Individual exam scores and course grades have been entered in the FAS
Gradebook. There is also a trend line and lines showing totals of
400, 365, 330, 295, 260, and 225 giving divisions between letter grades.
Another
scatter plot shows the comparison of grades on this exam with the
total classwork score.
Individual exam scores and course grades have been entered in the FAS
Gradebook. There is also a trend line and lines showing totals of
400, 365, 330, 295, 260, and 225 giving divisions between letter grades.
Comments on this page should be sent to: R. T. Bumby
Last updated: May 09, 2006